 Alex Dudov
After nearly four months of downward momentum, XRP (Ripple) appears to be at a critical turning point. Technical analysis reveals that the cryptocurrency has broken free from a prolonged RSI decline, a pattern that in the past has signaled the beginning of substantial upward price movements. With XRP currently trading around $2.39, traders are watching closely to see if history will repeat itself.
RSI Pattern Signals Potential Reversal
The daily chart shows a familiar technical setup that has played out multiple times in XRP's trading history. Whenever the RSI trendline breaks its descending structure, price action has consistently followed with strong upward momentum. Past RSI recoveries have triggered gains ranging from 28% to over 71%, and the current setup looks remarkably similar.
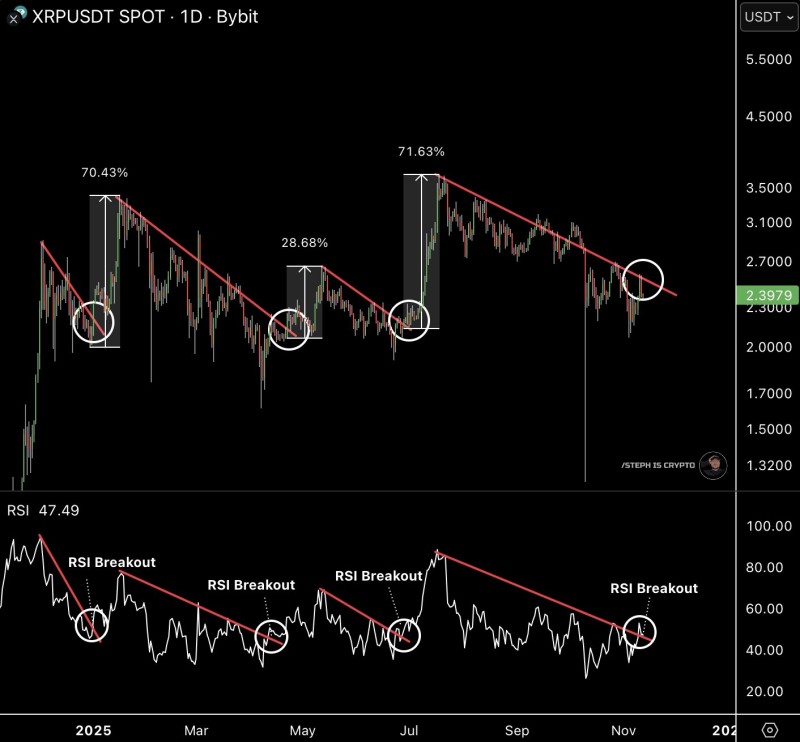
XRP is now positioned just above a long-term descending trendline, with the RSI sitting at 47.49 after months of steady decline. This combination of an RSI recovery alongside a break above price resistance has historically marked the beginning of renewed bullish momentum. The pattern shows clear symmetry across different time periods, with each RSI reversal displaying similar slope characteristics before rapid price acceleration.
Market Context and Price Levels
Despite ongoing caution in the broader crypto market, XRP's technical setup stands out for its consistency. Previous reversals occurred during similar periods of market uncertainty, yet XRP managed to outperform in the short term each time. Traders are now looking for confirmation that could push the asset toward resistance levels between $2.70 and $3.00.
However, the bullish case isn't without risks. If XRP fails to hold above the $2.30–$2.35 range, it could retest support near $2.10, where previous rebounds originated. The coming sessions will be crucial in determining whether buyers can maintain control.
 Alex Dudov


