 Marina Lyubimova
⬤ XRP is back on traders' radars after a recent analysis pinpointed October 10, 2025, as potentially the asset's final bottom. The long-term weekly chart shows multiple historical rally years and draws a parallel between the current structure and earlier multi-year expansion phases that led to massive price gains.
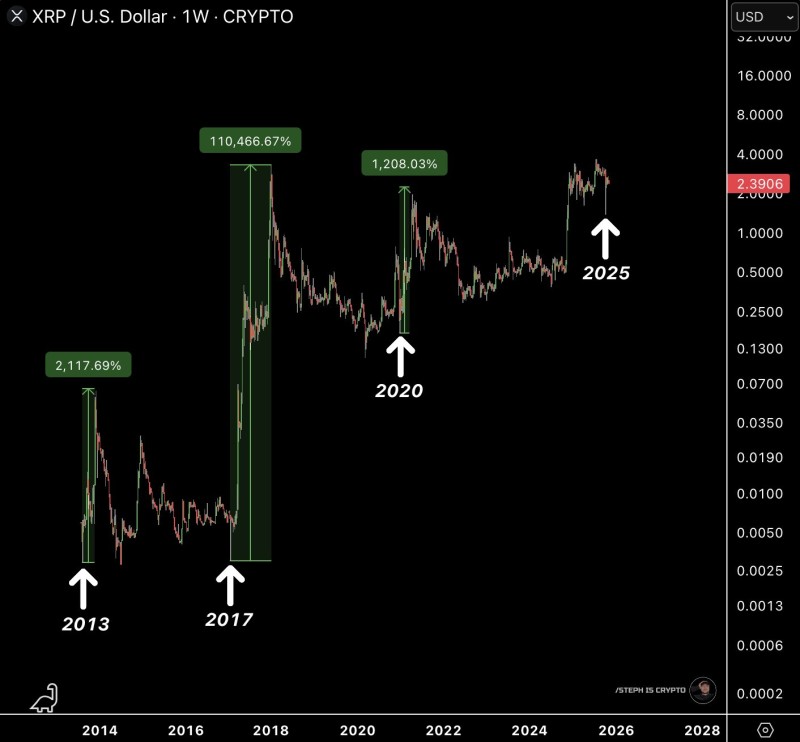
⬤ The chart highlights three major historical surges: around 2,117% in 2013, a staggering 110,466% in 2017, and roughly 1,208% in 2020. These rallies are marked by large vertical green bars. A new arrow labeled "2025" sits on the right side of the chart, suggesting this year could follow a similar pattern. XRP is currently trading near $2.39, sitting above earlier consolidation zones.
⬤ The key claim is that October 2025's low marks a turning point for XRP—though this reflects the analyst's view rather than a confirmed event. The chart leans on a repeating long-term structure where consolidation periods give way to significant upward moves. By comparing the current setup to past cycles, the analysis suggests XRP might be gearing up for another expansion phase.
⬤ Long-term cycle charts like this can shape market sentiment in a big way. When traders spot similarities between current price action and historical rally years, it influences expectations around momentum and capital flow across crypto. XRP's multi-year chart remains a key reference for anyone watching whether the token is about to enter another major upside leg.
 Marina Lyubimova


