 Usman Salis

XRP maintains position above crucial support levels as bearish pattern fails to fully materialize, setting stage for potential breakout.
XRP Price Action Defies Bearish Pattern on Hourly Chart
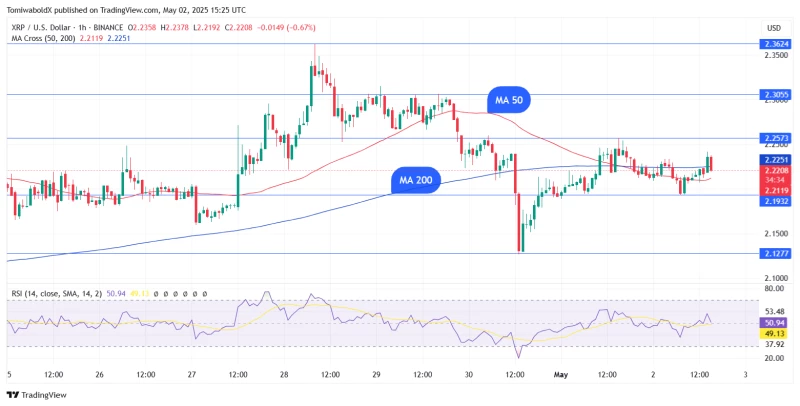
What appeared to be a looming "death cross" formation on XRP's hourly chart has failed to confirm, offering a ray of hope for XRP holders amid recent market uncertainty. The technical pattern, which typically signals bearish momentum when a shorter-term moving average crosses below a longer-term one, began forming but suddenly lost momentum before full confirmation.
Instead of continuing its downward trajectory, XRP has entered a period of tight consolidation around its critical hourly simple moving averages. The digital asset is currently trading between its hourly SMA 50 at $2.20 and SMA 200 at $2.22, creating an unusually narrow trading range that suggests market indecision.
XRP Trading Volume Indicates Potential Volatility Ahead
The current low-volatility environment for XRP typically precedes significant price movement, though market analysts remain divided on which direction the breakout might occur. This consolidation phase indicates that traders are awaiting stronger market signals before committing to positions in either direction.
"While the faint death cross still lingers on the hourly chart, the failure to break lower is a mild positive for bulls hoping for a rebound," noted technical analysts watching the pattern develop. Traders are now actively seeking catalysts that could propel XRP beyond its current constrained range.
The tight consolidation pattern rarely persists for extended periods, suggesting that XRP may soon experience increased volatility as market participants establish more decisive directional bias.
XRP Daily Chart Shows Critical Support Level Hold
Examining the daily timeframe provides additional context for XRP's current position. After declining for two consecutive sessions and reaching a low of $2.124 on April 30, the cryptocurrency has staged a modest recovery. This rebound has successfully lifted XRP back above the closely monitored daily SMA 50, which currently sits at $2.191.
At press time, XRP was trading at $2.23, showing a slight increase of 0.06% over the past 24 hours. Market technicians view XRP's ability to maintain a position above the daily SMA 50 as a potentially bullish indicator, though the modest gains suggest cautious sentiment remains.
The daily SMA 50 has historically served as a significant support or resistance level for XRP, often determining medium-term price direction. The asset's behavior around this technical indicator in the coming sessions will likely influence trader sentiment and potential position sizing.
XRP Price Targets and Support Levels to Watch
Market participants are closely monitoring XRP's price action around the daily SMA 50 in the coming days, as this will likely determine the next significant move. Should XRP decisively hold above this key indicator, analysts suggest the asset could potentially target the psychologically important $3.00 level, representing approximately 35% upside from current prices.
Conversely, if selling pressure reemerges, XRP may retest support in the $2.10 to $2.00 range. This zone represents critical support that, if breached, could signal a deeper correction for the digital asset.
The current consolidation phase comes amid broader market uncertainty, with many cryptocurrencies experiencing similar periods of indecision. XRP's relatively stable price action compared to some more volatile alternatives may attract traders seeking less dramatic price swings while still offering potential for meaningful returns.
Technical indicators beyond moving averages remain mixed, with relative strength indicators suggesting neither overbought nor oversold conditions at present. This neutral positioning further supports the narrative of a market in equilibrium, awaiting a catalyst to determine the next directional move.
As the cryptocurrency market continues to evolve, XRP's position as one of the more established digital assets provides it with liquidity advantages over smaller-cap alternatives. This liquidity often translates to more orderly price movements, particularly during periods of broader market stress.
Investors and traders alike will be watching volume indicators closely in the coming sessions, as increased trading volume often precedes breakouts from consolidation patterns like the one currently observed on XRP's hourly chart.
 Usman Salis


