 Alex Dudov
⬤ XRP has pulled back from recent highs and is now sitting right on its 200-week moving average — a zone that spent months acting as resistance and is now being tested as support for the first time. The weekly chart shows price consolidating in the $1.30–$1.40 range while momentum indicators push toward oversold territory. That RSI reading is worth watching: historically, it tends to mark points where selling exhaustion sets in.
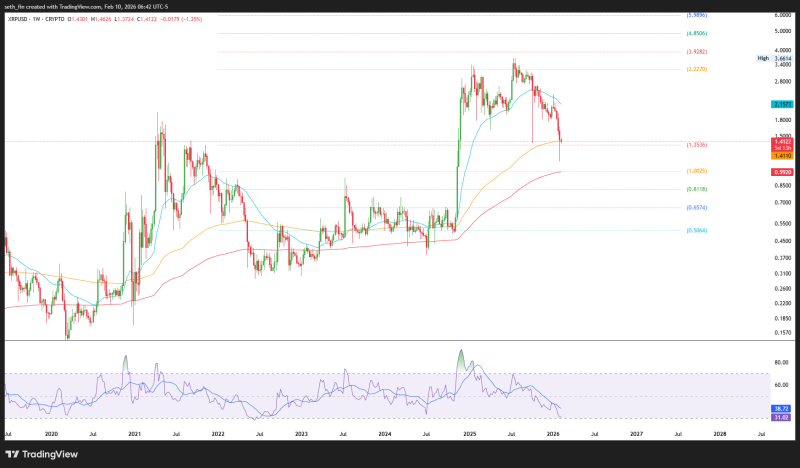
⬤ The overall structure still looks more like a support retest than a fresh breakdown attempt. As long as price holds this zone, the broader bullish trend stays intact — a dynamic well covered in XRP Price Outlook. The key question right now is whether buyers are willing to step in here. If they do, the market likely enters a consolidation phase before any meaningful recovery move.
⬤ If support gives way, the chart points to a natural next target at the $1.00 psychological level. That kind of step-down after losing a key moving average isn't unusual — it's happened before following rejection phases, as detailed in XRP Triangle Breakout Analysis. A clean break below the 200-week zone would shift the narrative from "healthy retest" to "structural concern" pretty quickly.
⬤ What makes this particular test significant is what the 200-week average actually represents. It's not just a line on a chart — it's where long-term holders and institutions have historically drawn a line between continuation and caution. Holding above it signals accumulation. Losing it signals something more serious. Either way, how XRP responds here will set the tone for market sentiment in the weeks ahead.
 Alex Dudov


