 Saad Ullah

Ripple's XRP is catching traders' attention again with fresh bullish momentum. The token recently broke out of a descending trendline and has held its ground during pullbacks, suggesting buyers are stepping in with confidence.
Technical Setup
Trader Zeni points to $4.804 as the next logical target, and the chart structure supports this view if the current momentum holds.
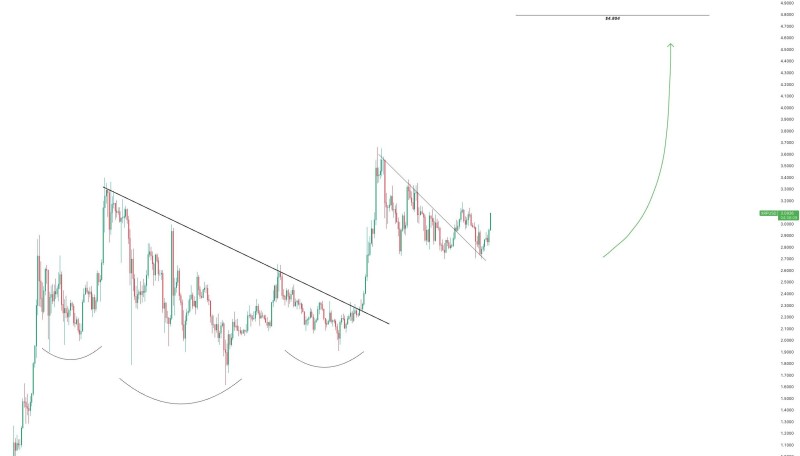
The chart shows three key developments that paint a bullish picture. First, XRP has formed an inverse head and shoulders pattern—a classic reversal signal that often precedes significant upward moves. Second, the token decisively broke above a long-term downtrend, marking a clear shift in sentiment. Third, and perhaps most importantly, recent pullbacks have held firm above the breakout zone near $3.00, turning former resistance into solid support.
Price Levels That Matter
The $2.80 to $3.00 zone is now the line in the sand for bulls. As long as XRP stays above this range, the path toward $4.804 remains open. That's the primary target based on the pattern's projection. However, if price drops below this support area, the bullish thesis would weaken and traders should expect a deeper retracement.
Beyond the chart patterns, XRP's rally has some fundamental backing. Ripple's payment solutions continue to attract institutional interest, and the broader crypto market sentiment has improved. These factors provide a supportive backdrop for the technical setup.
 Saad Ullah


