 Usman Salis
XRP traders are buzzing again, and this time it's all about a pattern that's played out twice before with explosive results.
The Historical Pattern
According to STEPH IS CRYPTO, there's a strong historical link between the end of Quantitative Tightening and massive XRP rallies—we're talking gains of 1,000% or more. Now, with QT seemingly on its last legs, the question on everyone's mind is whether history is about to repeat itself.
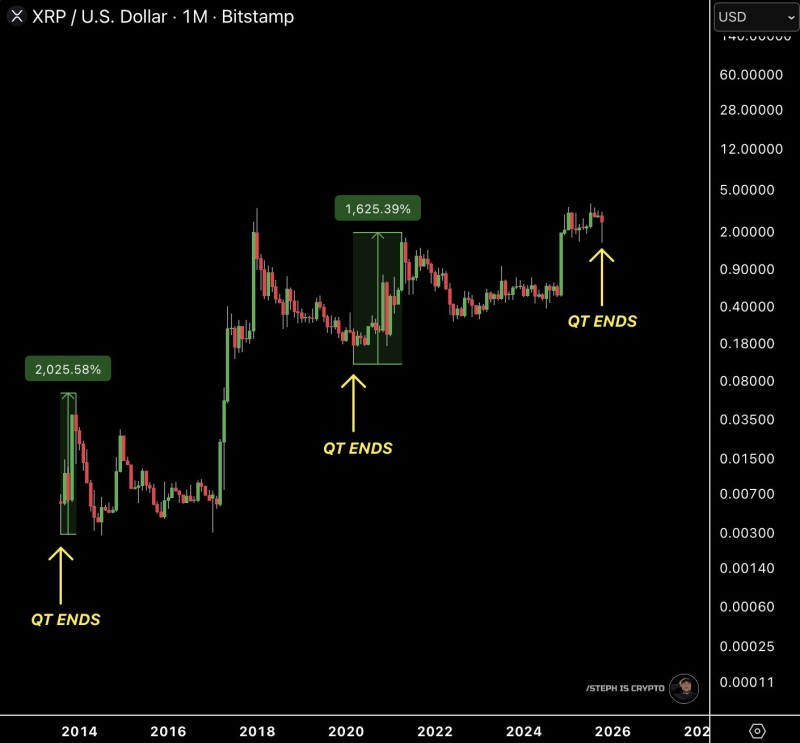
XRP's monthly chart tells a clear story. Every time QT has ended since 2014, the price has taken off:
- 2014: XRP surged over 2,025% after the first QT period wrapped up
- 2019–2020: Another QT ending brought a 1,625% rally as liquidity returned to markets
- 2025 (Projected): The pattern is setting up again—QT is nearing its end, and XRP is already showing early signs of momentum around the $2 mark
The chart shows XRP tends to consolidate during tight money conditions, then explodes higher once central banks ease up and liquidity starts flowing back into risk assets. Right now, XRP looks a lot like it did before those earlier breakouts—months of sideways action followed by early bullish stirrings.
Why This Matters
Quantitative Tightening drains liquidity from the financial system, putting pressure on speculative assets like crypto. But when QT ends—often followed by easier monetary policy—money floods back in, and high-risk plays like XRP tend to rally hard. XRP's role in cross-border payments and its institutional appeal make it particularly sensitive to these liquidity shifts.
If the pattern holds and central banks follow through with policy easing, XRP could be on the verge of another parabolic run. For now, traders are watching closely to see if this third cycle delivers the same fireworks as the first two.
 Usman Salis


