Peter Smith

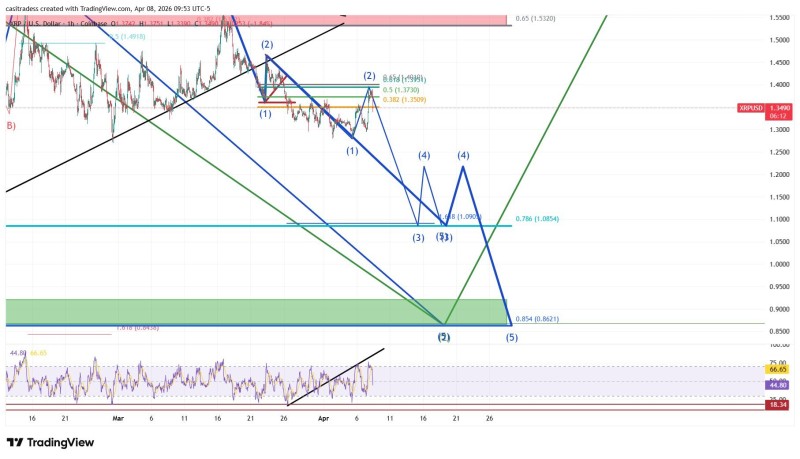
XRP's recent recovery may have already hit its ceiling. After pushing up to the $1.39 area on April 7, the asset ran out of steam - and according to TheCryptoBasic, that move looks less like the beginning of a new uptrend and more like a corrective wave playing out inside a bigger bearish structure.
The chart analysis suggests the rally served as a relief phase rather than a genuine reversal. Price action after the peak reinforces that reading - momentum stalled, and the structure held its bearish character throughout.
The move completed a relief rally within a broader bearish structure, with further downside now becoming the primary scenario.
Why $1.085 Is the Next Key XRP Level
With the recovery phase potentially wrapped up, attention turns to what comes next. The 0.786 Fibonacci extension near $1.085 stands out as the immediate downside target - a projected support zone derived from the broader wave structure. If XRP continues to lose ground, this is the first area where any meaningful reaction could develop.
This isn't a new pattern. XRP Price Analysis: Bearish Structure Targets $1.08 Support Zone laid out exactly how Fibonacci extensions tend to define these downside projections - and the current setup rhymes closely with that framework.
The 0.786 Fibonacci extension near $1.085 represents a projected support zone based on the broader structure - the first major point of interest for any potential price reaction.
XRP Could Slide to $0.86 If Bears Stay in Control
If selling pressure doesn't ease at $1.085, the chart opens the door to a deeper move toward $0.86. That level marks a lower support zone within the same bearish structure - not a sudden breakdown, but a continuation of the pattern already in motion.
Here's how the downside sequence breaks down:
- Initial downside target: $1.085 (0.786 Fibonacci extension)
- Extended downside scenario: $0.86
XRP Drops Toward Key Fibonacci Level After Failed Recovery covered a similar dynamic - how short-lived bounces can set the stage for the next leg lower rather than marking a turning point.
The progression toward $0.86 reflects a continuation of the bearish pattern rather than a sudden shift - the structure is working as expected.
Long-Term Picture Stays Constructive Despite Short-Term Weakness
What's worth noting is that the near-term bearish outlook doesn't invalidate the bigger picture. The analysis holds onto a long-term bullish case even as short-term targets point lower. That same duality has come up before - XRP Crypto News: Triangle Breakout Targets $10-$27 Zone showed how broader cycle patterns can remain intact through corrections that look alarming in the short run.
 Peter Smith