 Peter Smith

⬤ A newly published XRP liquidity heatmap on CoinGlass reveals intense concentration of short-term liquidity positioned near the $2.15 mark. The visualization shows a bright cluster indicating where substantial liquidation activity sits, hinting at potential price movement toward this zone. The chart maps liquidity thresholds across recent trading sessions, with the most prominent band forming around $2.15.
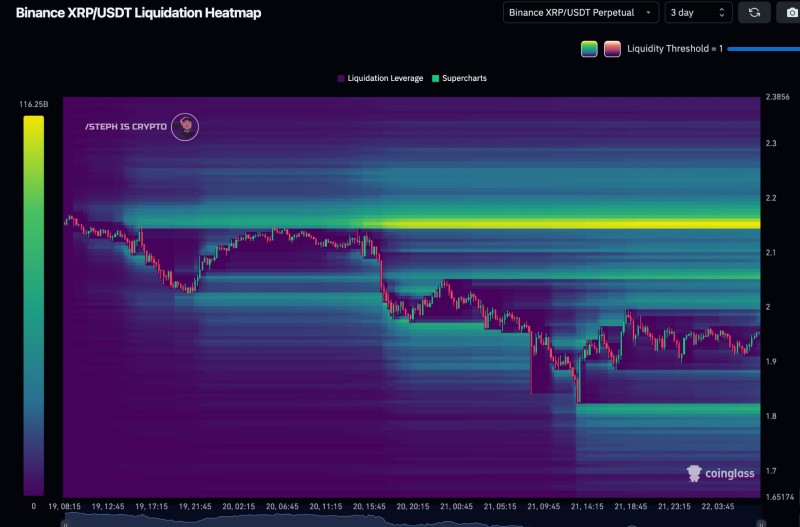
⬤ Current trading data shows XRP sitting below this highlighted liquidity zone following recent downward pressure and intraday swings. The heatmap displays notable overhead liquidity that could pull price upward in the short term. Yellow and green bands representing higher liquidation density align directly with $2.15, marking it as the most significant liquidity pocket in the immediate range.
⬤ Price action appears to be finding support near $1.90 based on heatmap readings, while deeper liquidity layers stack up above current levels. This setup mirrors typical leveraged market behavior where price tends to gravitate toward major liquidity pools as positions accumulate. The concentration at $2.15 highlights where market mechanics could drive price movement if bullish momentum returns.
⬤ Short-term liquidity concentrations carry weight in highly leveraged assets like XRP, often influencing directional moves. When significant liquidity builds at a specific price point, it can act as a magnet for market action as traders adjust their positions. A push toward $2.15 would signal a notable shift in near-term sentiment and could set the tone for upcoming trading patterns across the XRP market.
 Peter Smith


