 Usman Salis
⬤ XRP/USD is still trapped in the same consolidation range on the 8-hour chart, with no clear breakout happening yet. The price keeps moving sideways even though the bearish pattern is getting really stretched out. The chart shows a long downtrend channel with repeated rejections and price squeezing near the bottom of the range.
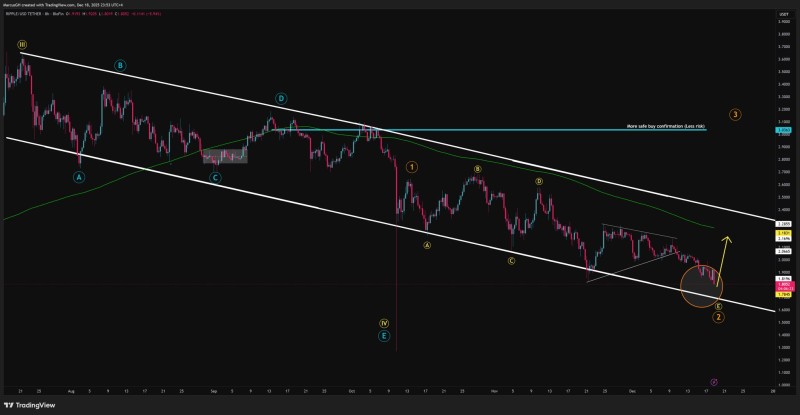
⬤ Right now, XRP is trading way below its 200-period exponential moving average—and it hasn't touched that level in quite a while. When price stays separated from the 200EMA for this long, it usually means the bearish momentum is overextended. This kind of situation doesn't last forever and often leads to unstable price action, even if there's no immediate reversal. Still, XRP hasn't broken any key levels that would signal a trend change.
⬤ The price keeps bouncing around in the same descending range, making lower highs but holding the lower support line. The fact that neither side can push through shows indecision—buyers and sellers are basically at a standoff. The chart also shows consolidation getting tighter near the trend support, which means volatility is building up rather than releasing. No breakout or breakdown has happened yet, so the market is still in wait-and-see mode.
⬤ This setup matters because when bearish conditions get stretched and price stays range-bound for this long, it usually leads to a sharp move once the pressure finally releases. The chart doesn't tell us which direction it'll go, but it's clear that tension is building and any trigger could spark a big reaction. Until XRP breaks out of this structure one way or the other, it's stuck in a high-tension zone where traders need to stay alert and watch closely for that potential turning point.
 Usman Salis


