 Artem Voloskovets
XRP has been a hot topic lately, with traders split on whether it's running out of gas or just coiling up for something bigger. While day-to-day sentiment stays mixed, the underlying market data paints a more encouraging picture. Technical charts—including liquidity heatmaps, RSI indicators, and long-term patterns—hint that XRP's current position might actually be the foundation for its next major move up.
What the Charts Are Saying
Market analyst Cryptoinsightuk points out that XRP is sitting in a zone with almost no downside liquidity—meaning there aren't many active sell orders below current levels. That naturally reduces selling pressure and raises the odds that the next big move will be upward as the market hunts for liquidity.
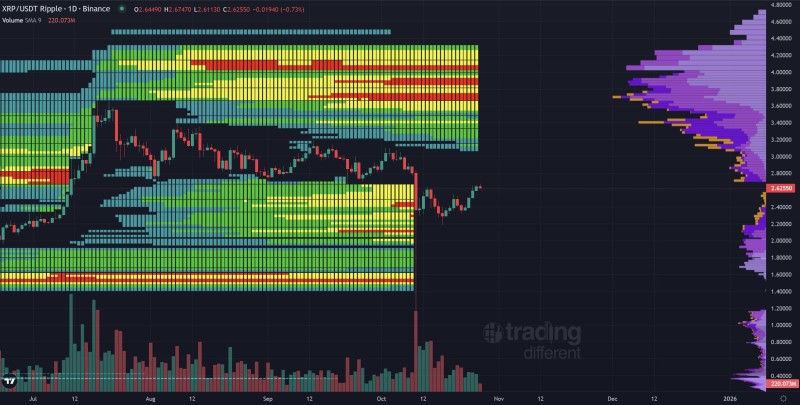
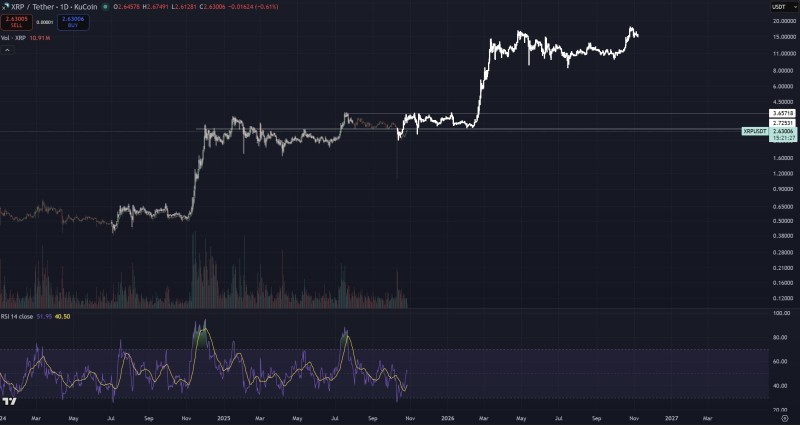
Liquidity maps show the real action—thick pockets of orders where exchanges and market makers do their thing—sitting between $3.20 and $3.60, well above XRP's current price around $2.62. These zones tend to act like magnets: once momentum kicks in, prices gravitate toward them to trigger volume and volatility.
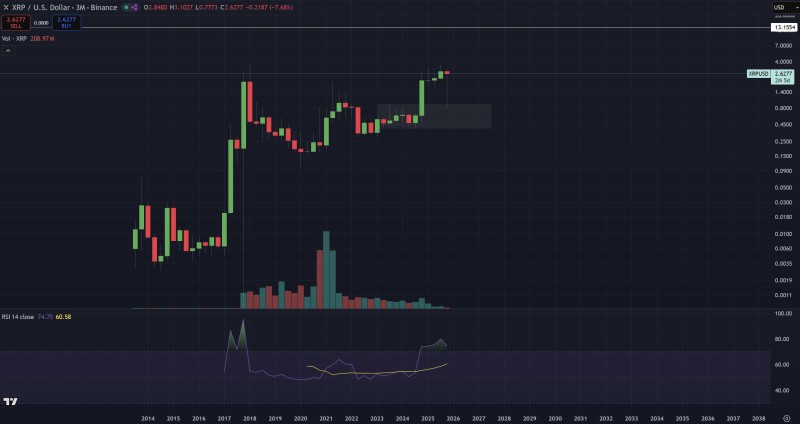
On the weekly chart, XRP's recent shakeout barely made a dent in its longer-term consolidation. The structure still looks solid, with higher lows forming after each dip. The quarterly chart adds even more confidence—XRP is holding comfortably above its $0.40–$0.70 accumulation zone, which served as multi-year support. That could mean a macro higher low is forming, often a sign that a bigger cycle move is brewing.
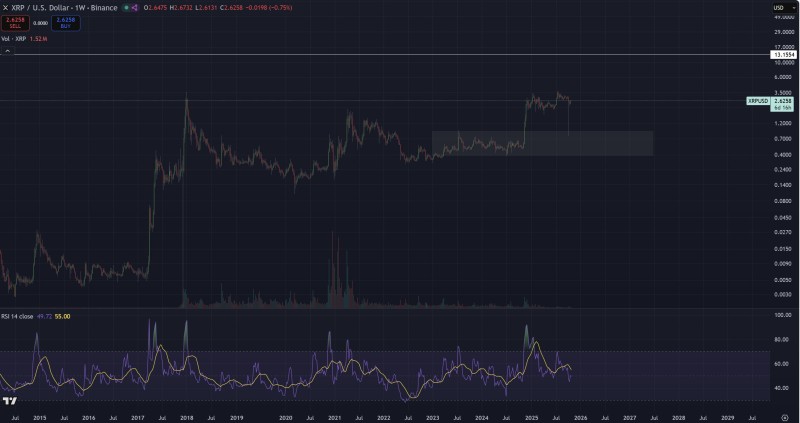
The Relative Strength Index (RSI) sits in neutral territory, nowhere near overbought levels, leaving plenty of room for upside once demand picks back up. Historically, every time XRP's daily RSI hit oversold levels, the asset bounced back hard—often doubling or tripling within weeks. Right now, RSI behavior mirrors those past turning points, especially the 2017–2020 accumulation phases. If patterns repeat, XRP might be gearing up for another major wave that pushes it toward the mid-$3 range or higher.
Unlike earlier cycles, XRP now trades in a more developed liquidity landscape. Heatmaps reveal dense buy interest around $2.40 and heavy sell-side liquidity above $3.20—suggesting market makers are positioning for expansion, not breakdown. Plus, the broader crypto market has settled down after a wild quarter. If Bitcoin keeps climbing and risk appetite flows back into altcoins, XRP could catch a fresh wave of institutional and retail demand, especially as liquidity gaps tighten.
Bottom Line
While doubters fixate on short-term sideways action, the technical evidence points to accumulation, not exhaustion. The lack of downside liquidity, steady RSI recovery, and historically bullish patterns all suggest XRP may be in the early innings of its next breakout phase. If liquidity shifts toward those upper zones, a run to $3.50–$4.00 could be the next logical stop. For now, the message from the charts is clear: patience might just pay off for those watching the bigger picture.
 Artem Voloskovets


