 Marina Lyubimova
XRP Price has been drawing attention as traders speculate whether a major breakout is finally underway. The token’s steady consolidation near key resistance levels hints at an upcoming volatility spike that could define its short-term trend. Interestingly, as investors explore ways to boost their trading capital, many are turning to no credit check loan options to seize potential market opportunities without traditional financial barriers — a trend reflecting the growing intersection between crypto trading and alternative financing.
XRP Technical Analysis
Crypto trader Amonyx recently teased an "insane breakout," and the chart seems to support that bold claim.
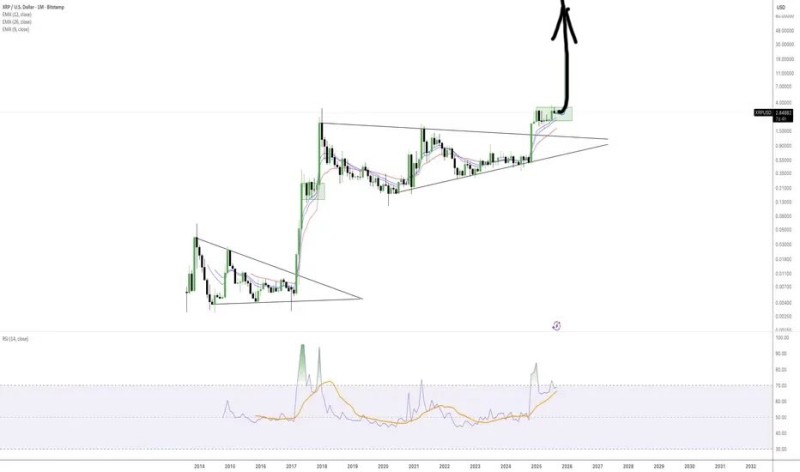
On the long-term monthly chart, XRP has broken out of a large symmetrical triangle—a pattern that's historically led to strong upward moves. This places XRP in what looks like a decisive bullish position.
The support zone sits between $1.50 and $2.00, an area that once acted as resistance and now provides a solid floor. Near-term resistance appears around $2.50 to $3.00, while the chart projects a target of $4.80 or potentially higher if momentum holds. The RSI shows bullish strength but hasn't hit extreme levels yet, suggesting there's still room to run before the market gets overheated.
Why This Rally Matters
A few factors are lining up in XRP's favor. Ripple's partnerships with banks and payment networks are fueling optimism about real-world adoption. There's also been some regulatory progress in the U.S. that's boosted investor confidence. Plus, with Bitcoin leading the market higher, altcoins like XRP tend to follow with delayed but often explosive rallies—it's a pattern we've seen play out before.
 Marina Lyubimova


