 Saad Ullah

XRP is quietly setting up what could be one of the most significant breakout patterns of the current market cycle. While many altcoins struggle to find direction, XRP's price action is painting a picture that has seasoned traders taking notice. The formation of a classic bull flag pattern suggests that after weeks of sideways consolidation, the digital asset might be ready to make its next big move.
XRP Price Technical Setup Shows Classic Bull Flag
Trading at $3.0254 with a modest 1.65% decline, XRP's weekly chart reveals the kind of technical pattern that makes chartists sit up and pay attention. The bull flag formation – characterized by a sharp rally followed by a period of sideways consolidation – is one of the most reliable continuation patterns in technical analysis.
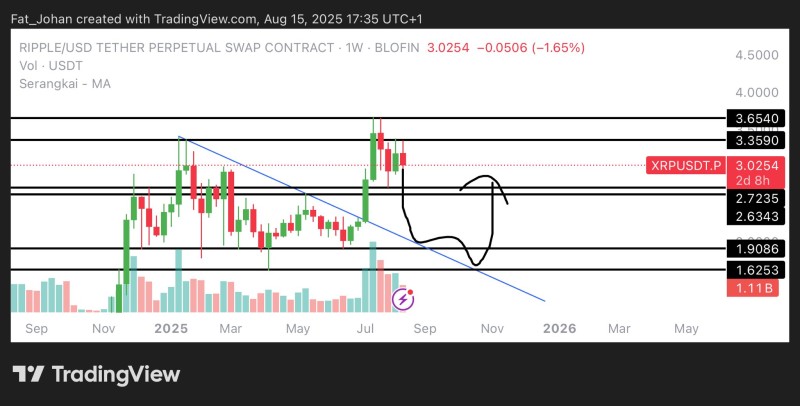
This isn't just any ordinary resistance level; it's the make-or-break point that could determine XRP's trajectory for the coming weeks. A weekly close above this threshold would likely confirm the bullish setup and potentially trigger a wave of buying from both retail and institutional traders who've been waiting on the sidelines.
What makes this setup particularly compelling is the patience factor. Smart money doesn't chase breakouts – they wait for confirmation. That's exactly what's happening here, with traders explicitly stating they'll only consider long positions after seeing a decisive weekly close above the resistance.
XRP Price Targets and Risk Management Strategy
For those looking to accumulate XRP on any potential dips, the sweet spot appears to be between $1.6253 and $1.9086. These levels represent historically significant support zones where buyers have previously stepped in with conviction. It's the kind of accumulation range that allows for favorable risk-reward ratios while maintaining exposure to the potential upside.
Should the breakout fail to materialize, XRP could find itself testing intermediate support levels at $2.7235 and $2.6343. These aren't necessarily bearish developments – they're simply part of the natural ebb and flow of market dynamics. Often, the most explosive moves come after multiple tests of key levels, building up energy like a coiled spring.
The beauty of this technical setup lies in its clarity. There's a clear level to watch for bullish confirmation, defined support zones for accumulation, and intermediate levels that would need to hold to maintain the overall constructive outlook. It's the kind of straightforward analysis that cuts through market noise and focuses on what really matters.
 Saad Ullah


