 Marina Lyubimova
⬤ XRP pulled back after an early rally fizzled out, keeping the price locked inside a multi-month descending channel. The market showed some initial strength, particularly in tech sectors, but those gains didn't last. XRP now hovers near the channel's lower boundary around the $2.19 level as selling pressure continues to dominate the session.
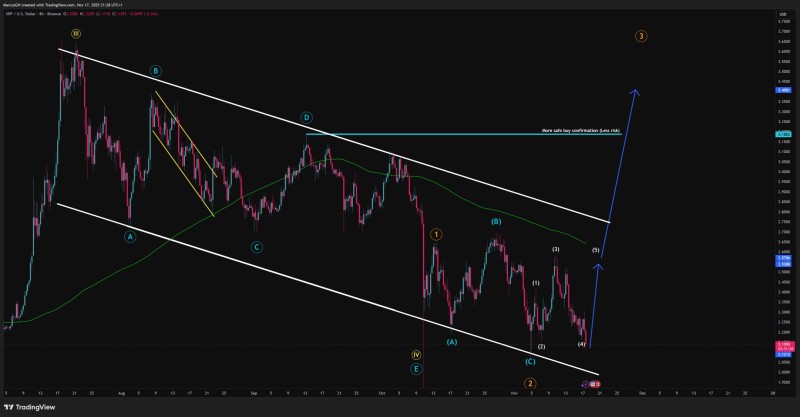
⬤ The chart shows a clear downward pattern with XRP bouncing between two trendlines that frame the correction. An Elliott Wave count marks the sequence with larger A, B, and C waves, plus smaller (1) through (5) subdivisions forming near the channel's bottom. A long-term moving average cuts through the middle, highlighting a mid-range level XRP hasn't been able to reclaim during this decline. The price is currently tracking close to the lower trendline where a potential pivot could occur.
⬤ The technical structure remains intact with no new developments. The chart includes a projected breakout path if XRP manages to push above the descending channel. A horizontal marker near $3.18 represents a cautious confirmation zone where stronger signals might appear if conditions shift. A longer-term projection toward the $3.40-$3.70 range is visible, though this depends on a significant trend reversal.
⬤ XRP continues to compress within this long-term corrective formation. The lower channel boundary plays a key role in shaping sentiment, especially with no changes to the overall outlook. How the wave structure, trendline support, and mid-range resistance interact will likely determine whether XRP stays under pressure or begins to find stability as traders watch for evolving conditions.
 Marina Lyubimova


