 Alex Dudov
⬤ XRP is once again testing its lower trendline on the 30-minute chart, putting short-term price action under the microscope. After pulling back from recent highs near $2.00, the price has squeezed into a tightening formation caught between descending resistance above and rising support below. A break beneath this lower trendline could flash an early warning that wave (B) in the broader corrective pattern might be wrapping up.
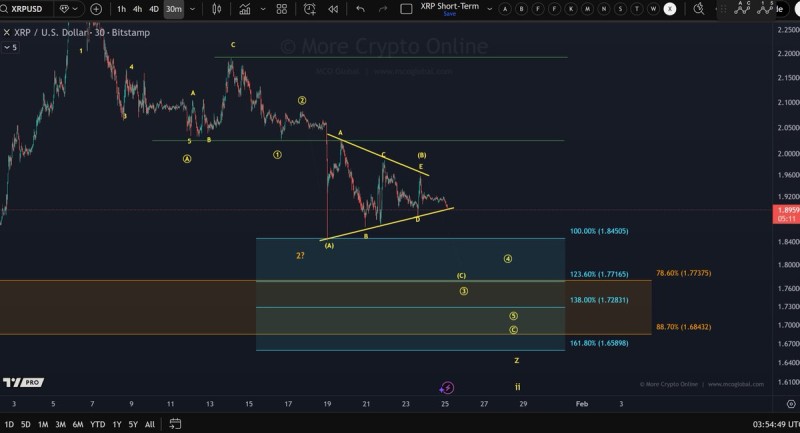
⬤ The chart reveals XRP carving out a converging structure following a sharp drop earlier in the session. That decline knocked price down from above $2.00 toward the $1.90 zone, where it's made several attempts to find footing. The lower trendline has been tested repeatedly now, which makes it technically significant. Price is still holding above this line for the moment, keeping the structure alive—but the persistent pressure is raising short-term red flags.
⬤ Fibonacci levels plotted on the chart offer a roadmap if the lower trendline gives way. The 100% retracement sits near $1.845, with deeper targets around $1.77 and a broader support zone stretching roughly between $1.72 and $1.68. The wave labeling suggests a confirmed break below the trendline wouldn't necessarily mean a trend reversal—it would more likely signal that wave (B) has finished and a fresh corrective leg is starting.
⬤ This technical moment matters for the wider crypto market because XRP often mirrors broader sentiment during corrective phases. Early signals of wave completion can stir short-term volatility and shift directional bias across altcoins. How XRP handles the lower trendline will help determine whether price steadies within the current pattern or slides deeper toward lower support, setting the tone for near-term market expectations.
 Alex Dudov


