 Saad Ullah
⬤ A recent analysis breaks down XRP's pure price action, showing how market structure can be read without indicators—just by watching liquidity behavior. The chart reveals how XRP consistently forms untapped highs and lows that eventually become targets, creating a story of unfinished business behind every directional move.
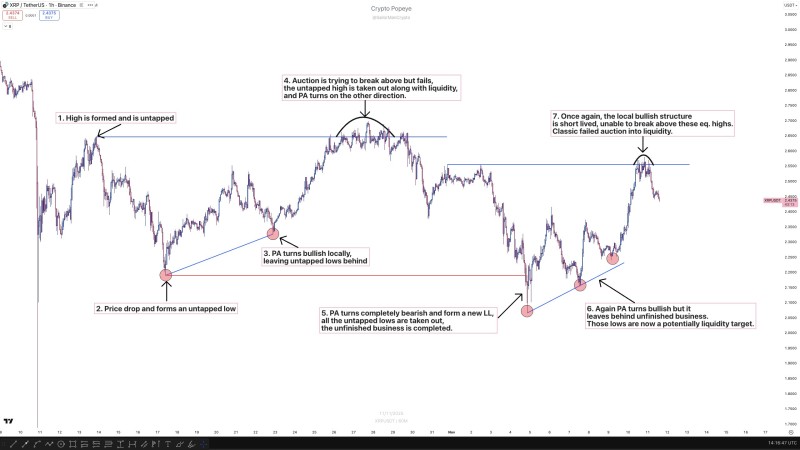
⬤ The sequence starts simple: a high forms and stays untapped, then price drops into an untapped low. XRP turns locally bullish, leaving new untapped lows behind. But when it tries to push higher, the attempt fails—clearing the previous untapped high along with its liquidity before reversing hard. This leads to a full bearish flip, forming a lower low and taking out all those untapped lows, completing the liquidity sweep.
⬤ Then the market flips bullish again—but leaves more untapped lows in its wake, setting up another potential target. That bullish structure doesn't last long. XRP can't break above equal highs, showing yet another failed liquidity grab exactly where you'd expect it. Every step—mapped out visually from point 1 through 7—lines up perfectly with this liquidity-driven behavior.
⬤ Why does this matter? Because liquidity-driven moves often signal bigger shifts in market structure. While this isn't a forecast, it highlights how tracking untapped highs and lows helps traders spot areas where price might return. For XRP, these repeated interactions with unfinished liquidity zones are clearly shaping momentum in the short term.
 Saad Ullah


