 Usman Salis
XRP has captured traders' attention with an unusual technical setup that historically precedes major price movements. The cryptocurrency is forming a pattern that mirrors conditions seen before previous exponential rallies, making this a critical moment for the digital asset.
Technical Analysis
XRP is breaking above long-term resistance around $2 after years of trading below this level. The breakout appears to be gaining momentum, with the token showing strength on quarterly timeframes. This $2 zone has now transformed from resistance into potential support, which is crucial for maintaining upward momentum.
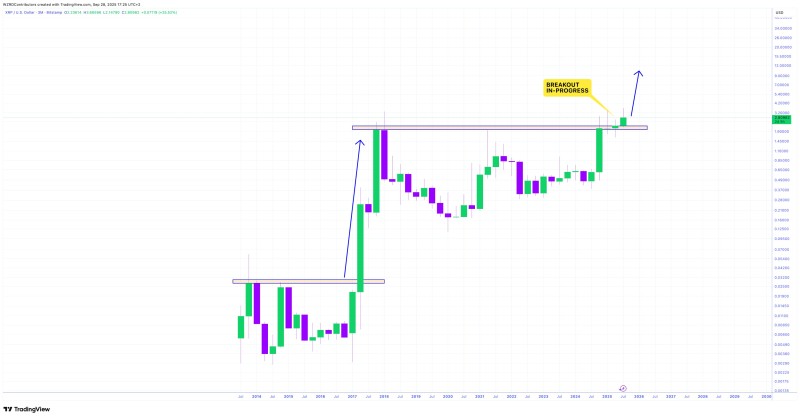
Looking at historical patterns, XRP experienced a similar setup in 2017 before its massive price surge. The current formation suggests possible targets in the $5-$7 range if the breakout confirms, with even higher levels possible as market conditions improve.
Market Drivers
Several factors are supporting XRP's bullish outlook. Regulatory clarity has reduced uncertainty that previously weighed on the asset, making it more attractive to institutional investors. Ripple's expanding presence in global payment systems continues to strengthen XRP's real-world utility. Additionally, we're seeing capital rotation from Bitcoin into major altcoins like XRP as investors seek higher potential returns.
Key Levels to Watch
The most important signal will be how XRP closes on the quarterly timeframe. A solid close above previous cycle highs would likely confirm the start of a new uptrend. However, traders should remain cautious of false breakouts, where prices briefly rally before falling back below key resistance levels.
Conclusion
XRP stands at a defining technical juncture that could determine its trajectory for the coming cycle. If the breakout holds, we may witness a rally comparable to previous bull runs. For long-term holders, the quarterly chart patterns suggest this could be the beginning of something significant, though the next few weeks will be crucial in confirming whether this setup delivers on its potential.
 Usman Salis


