 Saad Ullah
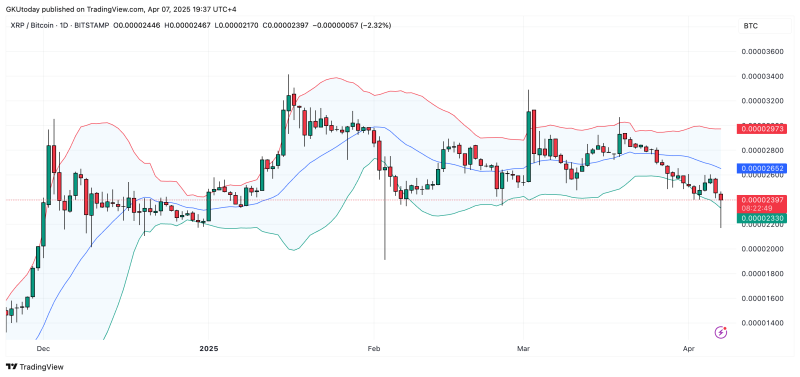
XRP/BTC pair shows signs of a potential bottom formation after breaking below the lower Bollinger Band, technical indicators suggest a possible 11% upward move if the daily candle closes above critical support.
XRP (XRP) vs Bitcoin (BTC): Technical Breakdown Points to Possible Bottom
The XRP-to-Bitcoin trading pair has reached a critical technical juncture that could signal a significant shift in momentum. On April 7, the daily chart displayed a notable breakdown below the lower Bollinger Band, marking the most significant bearish confirmation for the pair in several months. This technical development represents the most decisive level XRP/BTC has encountered since the beginning of its downtrend.
The pair dropped to 0.00002267 BTC, breaching the lower Bollinger Band boundary before experiencing a modest recovery. Such proximity to the lower band's limit is a relatively rare occurrence in technical analysis and typically signifies either an important turning point or the beginning of an accelerated decline. Based on the current market structure, indicators suggest this could potentially represent a bottom formation for XRP against Bitcoin.
XRP Enters Critical Zone for Technical Rebalancing
With the lower Bollinger Band now having been tested and showing initial signs of recovery, the XRP/BTC pair has officially entered a zone where technical rebalancing may occur. If this rebalancing materializes as expected, traders could witness an approximately 11% upward movement from current levels. This potential rally would target the middle Bollinger Band, which is represented by the 20-day moving average.
This technical pattern is particularly noteworthy for XRP traders and investors who have been monitoring the asset's performance against Bitcoin during recent market fluctuations. The Bollinger Band indicator, which measures market volatility and potential price extremes, is signaling a possible reversal after extended downward pressure.
XRP Recovery Depends on Critical Daily Close
Market analysts emphasize that for this bullish scenario to gain credibility, a daily close above the lower Bollinger Band remains essential. Without this confirmation, the ongoing slide of XRP against BTC could potentially continue, nullifying the reversal signal.
The current technical setup represents a pivotal moment for XRP traders, as the asset attempts to establish support after extended underperformance against Bitcoin. The 11% potential upside target would provide welcome relief for XRP holders who have weathered significant comparative weakness.
What This Means for XRP Investors
For investors holding positions in XRP, this technical development comes at a critical juncture. The cryptocurrency market has been experiencing heightened volatility, with individual assets often moving independently of broader market trends. The XRP/BTC pair's potential bottoming process could signal an opportunity for relative outperformance if the technical signals hold true.
The Bollinger Band breakdown and subsequent recovery attempt highlight the importance of key technical indicators in cryptocurrency trading pairs. While Bitcoin often drives overall market sentiment, altcoins like XRP frequently experience periods of divergence, creating trading opportunities in these paired relationships.
Traders will be closely monitoring the daily close to confirm whether XRP has indeed established a temporary bottom against Bitcoin, potentially setting the stage for the projected 11% recovery toward the middle Bollinger Band target.
 Saad Ullah


