Usman Salis

XRP is compressing into a decisive technical structure, with its market cap steadily climbing into a long-standing resistance zone. Analyst JD flagged the setup as one reflecting mounting pressure that could precede a sharp expansion move if the structure resolves to the upside. XRP Price Analysis: Is an Explosive Breakout Ahead? explores the broader picture in detail.
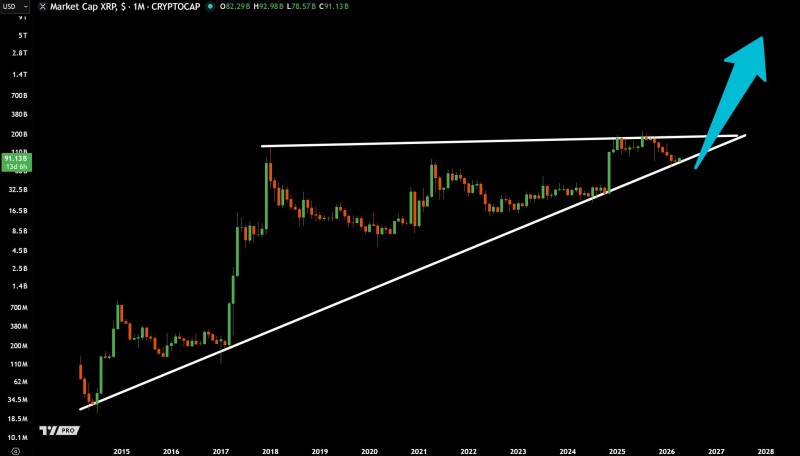
The chart shows XRP's market cap forming a clear ascending triangle - defined by a flat resistance zone near the $100 billion area and a rising trendline of higher lows stretching from the early cycle base. This structure has developed over several years, with price repeatedly approaching the same upper boundary but failing to break through decisively.
The setup reflects mounting pressure that could precede a sharp expansion move if the structure resolves higher.
A Multi-Year XRP Triangle Near Breaking Point
At the same time, each pullback has been shallower than the last, reinforcing the upward-sloping support line. The key technical elements visible on the chart:
- Horizontal resistance capping upside near prior peaks
- Rising support trendline connecting higher lows
- Tightening price action toward the apex of the triangle
- No breakdown below structural support despite multiple consolidations
This combination reflects sustained compression rather than rejection. And in markets, compression near resistance is rarely a neutral signal - it tends to resolve one way or another with force.
The Tightening XRP Range Traders Are Watching
Recent price action shows XRP holding close to resistance after a strong upward move, followed by a controlled pullback that respected the ascending support line. The structure remains intact, with price continuing to trade within narrowing boundaries. XRP News: Can $3 Resistance Finally Clear? breaks down exactly where the key level sits and what a clean break would mean.
Repeated tests of resistance without a significant breakdown suggest that selling pressure at this level may be weakening.
Unlike earlier cycles marked by sharp reversals, the current pattern shows stability near the top of the range. Repeated tests of resistance without a meaningful collapse suggest that sellers are losing control of the level. Similar consolidation patterns have historically preceded expansion phases in XRP, where prolonged sideways movement transitions into a strong directional move.
Where the XRP Structure Could Resolve
The defining feature of the current setup is the convergence between resistance and rising support. As price approaches the apex of the triangle, the probability of a breakout increases - there is simply less room left for sideways movement. A decisive move above the $100 billion resistance zone would mark a structural shift, as XRP has not sustained a breakout beyond this level in previous cycles.
In technical terms, compression at resistance is often where the next major move begins.
At the same time, the ascending trendline remains the key support holding the structure together. A break below it would invalidate the pattern and shift the short-term outlook. For those tracking longer-term targets, XRP Price Forecast: Analyst Eyes $15 by March, $70 by May outlines what a full breakout scenario could look like.
 Usman Salis