Usman Salis

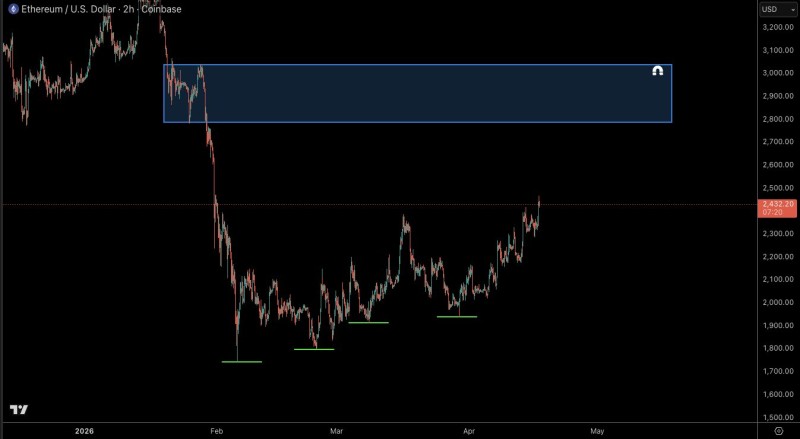
Ethereum is steadily rebuilding after its earlier selloff, and the current chart structure is starting to look more constructive with each pullback. According to Castillo Trading, the higher-low pattern on ETH is still playing out, keeping the door open for a move into the $2,800 - $2,900 area.
The chart shows a sharp drop from above $3,000 into an early-February low near the mid-$1,700s, followed by a recovery phase built on successive higher lows. Those rising support points are the most important technical feature right now - they show buyers stepping in earlier on each dip rather than waiting for a deeper retracement.
The higher-low pattern on ETH is still playing out, keeping the door open for a move into the $2,800 - $2,900 area.
The ETH Recovery Pattern Is Becoming Clear
That does not yet amount to a breakout, but it does show improving structure. Price has climbed back toward the mid-$2,400s, and the path higher has been built through stair-step advances rather than a single vertical squeeze. That kind of recovery often carries more technical credibility because it reflects repeated defense of support rather than one-off momentum.
Related coverage on ETH Holds 200 EMA at $2,104 as Key Resistance Zone Looms focused on a similar setup - ETH stabilizing and working back toward overhead resistance from a key moving average support.
Price climbing through stair-step advances rather than a single vertical squeeze tends to carry more technical credibility - it reflects repeated defense of support rather than one-off momentum.
Why the $2,800 - $2,900 ETH Resistance Zone Matters
The next major overhead area sits roughly between $2,800 and $3,000, with the most relevant focus on the $2,800 - $2,900 portion of that range. This is the same area where ETH previously traded before breaking down, which makes it a natural resistance zone on any continued rebound.
Price is still below that region, so the bullish case here is not about claiming Ethereum has already broken resistance. It is about the market maintaining a sequence of higher lows while trending back toward a prior supply zone. That distinction matters. See also: ETH Hits $2,200 Resistance Wall: 3 Key Levels to Watch Before the Next Move - a similar read on Ethereum defending support while pressing into the next resistance band.
ETH Structure Still Depends on Buyers Defending Pullbacks
The most relevant signal in the current setup is straightforward: ETH keeps making higher lows. As long as that pattern remains intact, the recovery structure stays alive and the $2,800 - $2,900 zone remains a reasonable upside target.
As long as the higher-low pattern remains intact, the recovery structure stays alive and the $2,800 - $2,900 zone remains a reasonable upside target.
If the pattern starts to fail, the move becomes less about continuation and more about whether the rebound was only corrective. For now, though, the chart still favors the former. For broader context on where ETH could head next, Ethereum Holds Bullish Structure on Monthly Chart as $3,000 Levels Remain in Play covers the higher-lows theme from a longer timeframe perspective. Ethereum is not breaking out yet - but it is climbing in a way that suggests the market is working back into a major resist
 Usman Salis