Saad Ullah
⬤ The latest Binance XRP/USDT liquidation heatmap shows a huge cluster of liquidation liquidity sitting right above where XRP is trading now. This means tons of leveraged positions could get liquidated if XRP pushes higher. The market's basically ignoring this massive overhead liquidity pool, even though these concentrations usually pull price toward them like a magnet. The data shows XRP hovering near $2.77 with roughly $4.72 billion in estimated liquidation leverage stacked up in that zone.
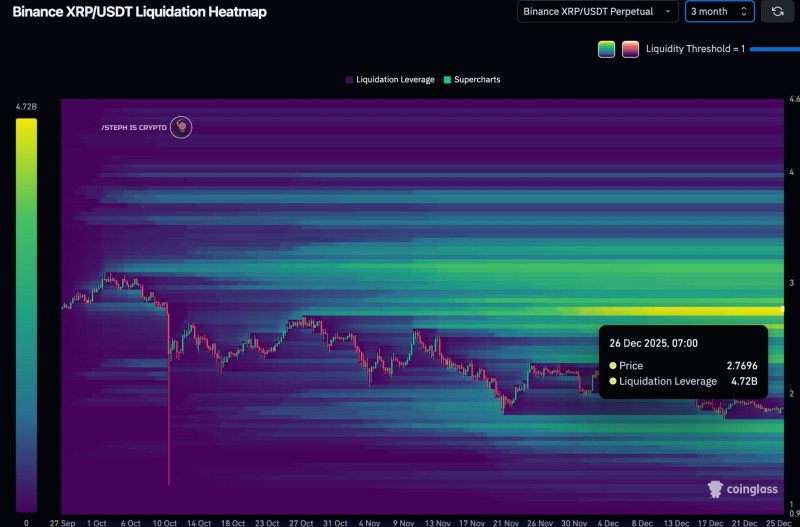
⬤ Looking at about three months of price action, XRP's been in a long decline followed by sideways movement, while that liquidity intensity above price just keeps building. The brightest green-yellow bands on the heatmap mark where liquidations are most dense, and they get thicker as you move up in price. Translation: a bunch of leveraged traders are sitting on shaky ground, and if XRP rallies into those levels, things could get wild fast when liquidations start firing off.
⬤ But here's the thing - despite all that buildup, XRP's just been trading below this zone without much reaction. It's been stuck in a tight range through December after dropping earlier. That tells you broader market sentiment and macro factors are still calling the shots, even though the liquidation map is flashing warning signs about what could happen if XRP climbs toward that liquidity cluster.
⬤ Why does this matter? Because when price approaches these big liquidation zones, you often see sharp, sudden moves. If XRP eventually grinds up toward those levels, forced position closures could kick off serious short-term volatility and flip sentiment quickly. On the flip side, if it stays below the cluster, price action might just keep drifting. How XRP handles this overhead liquidity pool will likely shape where momentum goes from here.
 Saad Ullah