 Usman Salis
XRP traders are paying close attention to liquidity patterns as the market shows signs of a possible directional move. A substantial liquidity pool has emerged at the $2.25 level, catching the eye of market analysts who believe it could drive near-term price action.
Chart Analysis: What the Liquidity Map Shows
Analyst STEPH IS CRYPTO recently pointed out this accumulation, sparking discussion about whether XRP might be setting up for a liquidity grab.
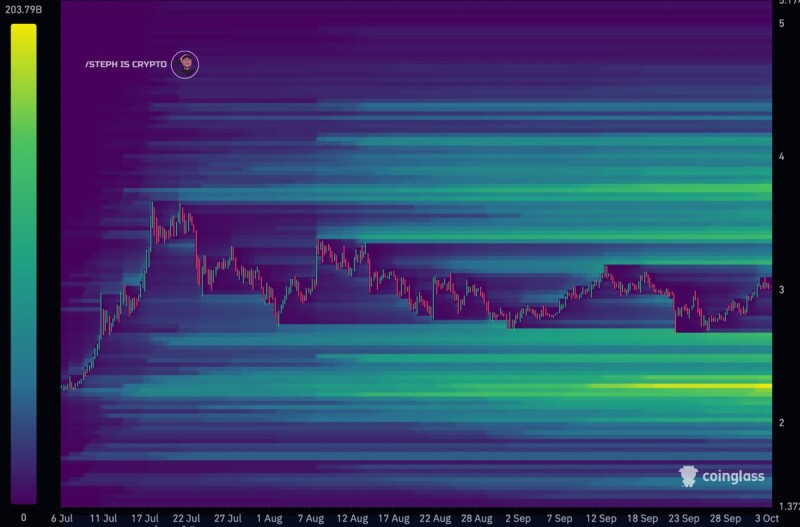
The Coinglass heatmap reveals several important details worth noting:
- Dense liquidity cluster at $2.25 – This concentration makes it a natural target for price movement
- Current trading above $3 – XRP has been consolidating sideways between $2.50 and $3.20 for several weeks
- Strong support zone at $2.00–$2.25 – Heavy buyer interest is visible in this region based on liquidity concentration
- Thin resistance above $3.50 – Less selling pressure upside, but also weaker support if momentum weakens
This configuration suggests that if XRP faces selling pressure, the $2.25 zone could become both a magnet for stop-loss hunting and a potential bounce point.
Why the $2.25 Level Matters
Markets tend to gravitate toward high-liquidity zones, often triggering clusters of stop-loss orders before reversing direction. These pools also attract institutional players looking for efficient trade execution. After extended consolidation, sharp directional moves become more likely. So the $2.25 area could serve as both a short-term price target and a key risk level for swing traders positioning themselves.
The SEC case against Ripple continues to influence sentiment, though recent developments haven't had the same impact as in previous years. XRP's role in cross-border payments remains its core long-term value proposition. With Bitcoin and Ethereum holding steady, altcoins like XRP remain sensitive to overall crypto market sentiment and risk appetite.
 Usman Salis


