 Peter Smith
As crypto markets settle into consolidation mode, XRP (XRP/USDT) is displaying one of its most telling technical setups this quarter. Fresh liquidity maps on both hourly and daily charts show dense clusters of trading activity—signaling that bigger players might be gearing up for a significant move.
XRP Builds Liquidity Between $2.40 and $2.70
According to Cryptoinsightuk, this liquidity buildup suggests XRP's next major shift—whether up or down—could be imminent.
Recent liquidity heatmaps for XRP/USDT on Binance reveal clear accumulation zones forming between $2.40 and $2.70, where both buyers and sellers have stacked heavy orders. These areas—marked in yellow and red on the heatmap—show where liquidity is most concentrated, often a sign that market makers and institutions are actively engaged.
This kind of buildup typically comes before sharp volatility. Once these order clusters get filled or swept away, price tends to move quickly toward areas with less liquidity. Right now, XRP's trading range represents a crucial battleground before its next big directional push.
Key Technical Levels Across Timeframes
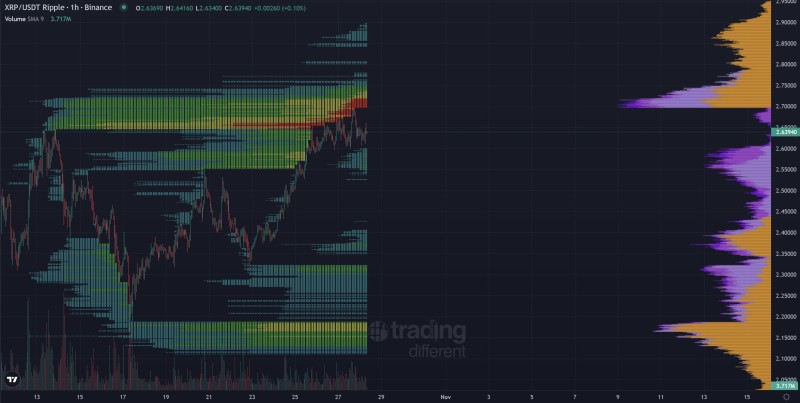
Hourly Chart: Resistance Tightens Near $2.65–$2.70 On shorter timeframes, XRP is squeezed into an increasingly narrow range between $2.60 and $2.70, with noticeable liquidity pressure near the top. The upper band around $2.65–$2.70 shows dense sell-side activity (red and yellow zones), while volume data confirms that $2.55–$2.70 remains the most active trading zone. Unless XRP breaks above $2.70 with strong volume, a minor dip toward $2.45 is likely before any real upward momentum kicks in. This compression is a classic setup for a volatility breakout.
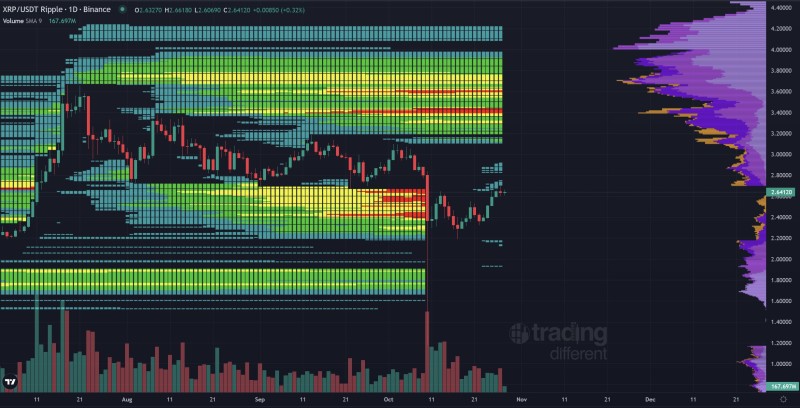
Daily Chart: Deep Liquidity Layers Form at $2.20–$2.50 Zooming out, the daily chart reveals heavy volume buildup between $2.20 and $2.50—a major support base acting as a re-accumulation zone after October's pullback. Dense buy-side liquidity (green-to-yellow areas) below $2.50 suggests large resting orders, likely from institutional or algo-driven players. Above $2.80, liquidity thins out significantly, meaning a breakout through that level could send XRP rapidly toward $3.00 with little resistance in between. The volume profile highlights $2.40–$2.50 as the core trading range and $2.80–$3.00 as the next breakout target.
Liquidity mapping helps reveal where big players are accumulating or offloading positions. XRP's current setup—with balanced liquidity on both sides—suggests market makers may be setting up for a larger move.
- Upside scenario: A clean break above $2.80 opens a liquidity vacuum toward $3.00, allowing for rapid upward movement.
- Downside scenario: Losing support above $2.50 could trigger a sweep of lower liquidity near $2.20–$2.30 before any recovery.
With Bitcoin dominance steadying and altcoin rotation starting to pick up, XRP's liquidity structure makes it one of the key assets to watch heading into November.
 Peter Smith


