 Usman Salis

XRP sits at a crucial juncture. Following a strong rally, the token is now consolidating within a support zone amid profit-taking and pressure from a strengthening U.S. dollar.
XRP Chart Analysis: Correction Within Elliott Wave
Recent analysis from DustyBC Crypto points out that wave (E) of the current Elliott Wave structure hasn't completed yet, meaning XRP's next significant move could swing either direction. The chart reveals this tug-of-war between bulls and bears with striking clarity.
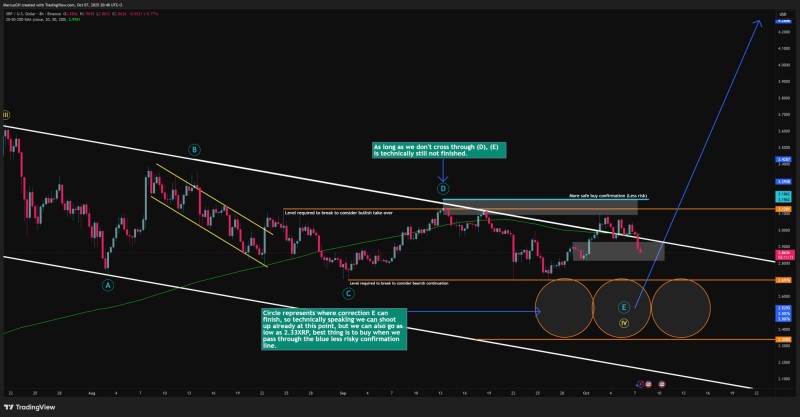
The chart displays XRP forming a corrective Elliott Wave pattern. Price rallied but couldn't decisively break above the (D) level near $3.10–$3.20, which remains a stubborn resistance barrier. Until this level cracks, wave (E) stays technically open-ended.
Key levels to watch:
- Immediate Support (Grey Box): $2.85–$2.95, where XRP currently holds ground
- Lower Support Targets: Possible drops to $2.67 and $2.33, flagged with orange circles on the chart
- Long-Term Channel Support: A broader descending trendline around $2.10–$2.20
- Bearish Resistance: $3.10–$3.20 must break for bulls to regain control
- Safer Bullish Entry: A confirmed breakout above $3.42–$3.79 offers stronger conviction with lower risk
What's Behind the Pullback?
The correction stems from several factors working in tandem. Dollar strength through DXY gains has squeezed risk assets including crypto. After such a sharp rally, profit-taking is perfectly normal market behavior. The rejection at the (D) resistance level reinforced selling pressure, while broader crypto market uncertainty keeps volatility elevated.
Traders face different entry points depending on risk tolerance. Aggressive entries within the grey support zone carry higher risk but potential upside. Conservative traders might wait for a breakout above $3.42 for stronger bullish confirmation. On the downside, losing support at $2.67 or $2.33 could spark a deeper correction.
 Usman Salis


