 Peter Smith

⬤ XRP has been steadily drifting lower throughout late December, filling in that October wick while closing in on a descending triangle breakdown target around $2.10. The price action looks methodical rather than panicky—more like a controlled slide than a sudden crash, with buyers stepping back as the asset gravitates toward a clear liquidity zone sitting just below current levels.
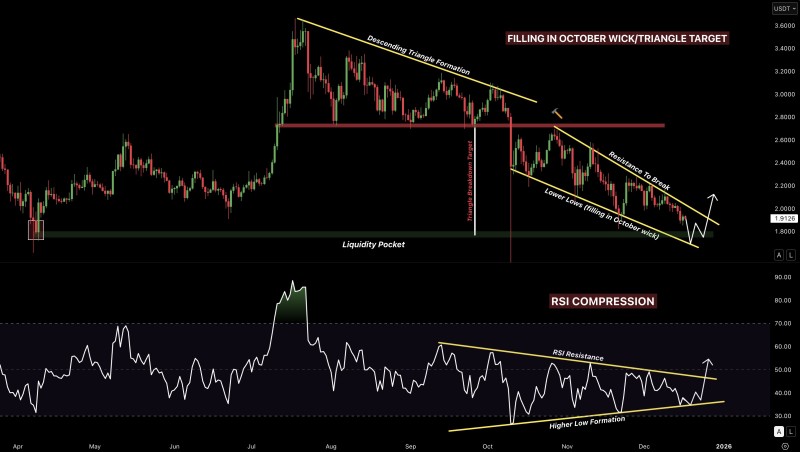
⬤ The chart paints a familiar picture: XRP broke down from a descending triangle earlier this month and has been carving out lower highs ever since. Price is hugging the bottom of a downward channel, methodically working through that October wick with each passing day. That liquidity pocket below? It's where limit orders are likely stacked up, waiting to catch the asset if it drops into that zone—exactly what the ongoing wick fill suggests is happening.
⬤ The momentum story gets interesting when you look at the RSI. While price keeps trending down, the relative strength index is actually forming higher lows—classic bullish divergence. The RSI is getting squeezed between rising support underneath and resistance overhead, which typically signals that selling pressure is running out of steam rather than building up. It's the kind of compression that often precedes a directional shift, though timing remains uncertain.
⬤ What makes this setup worth watching is how everything's lining up in the same area. XRP is hitting a zone where the triangle target, that October liquidity, and momentum signals all converge around $2.10. How the asset behaves here could set the tone for crypto markets heading into year-end—traders are watching closely for any signs that this multi-week correction might be running out of room to fall.
 Peter Smith


