 Usman Salis
⬤ XRP's technical structure remains solid, with the asset still trading within a large symmetrical formation marked by ascending support and descending resistance. This multi-year pattern has held through extended periods of sideways movement, showing consistency even as the crypto market swings around it.
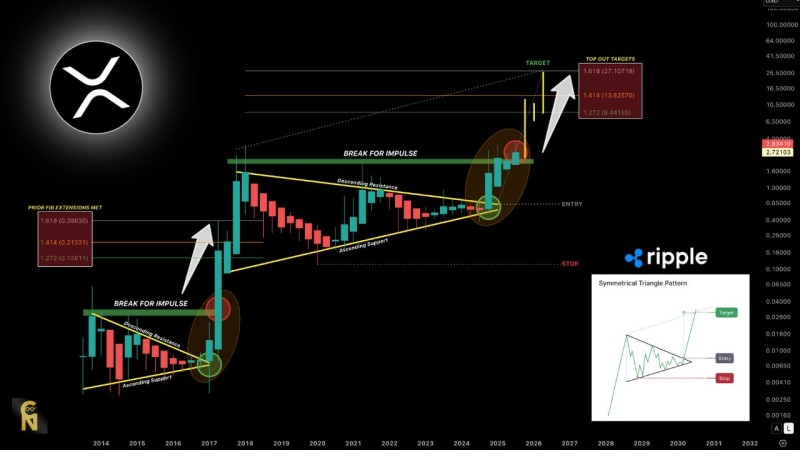
⬤ The risk here is straightforward: if XRP breaks below its ascending support line, the structure falls apart and deeper downside could follow. But as long as it stays within this framework, the setup stays intact and leaves room for potential upside when the pattern eventually resolves. The chart isn't making predictions—it's tracking whether XRP is holding its technical boundaries.
⬤ The symmetrical triangle has defined XRP's behavior through previous cycles, with past "break for impulse" moments showing what happened when the structure held before bigger moves kicked in. Fibonacci extension zones from earlier rallies are marked on the chart as reference points, along with projected target areas. These aren't guarantees—they're just technical landmarks showing where the pattern could lead if it plays out cleanly.
⬤ For traders and investors, long-term patterns like this matter because they help frame what might come next. When an asset spends years inside a well-defined formation, it's usually building up for an eventual breakout—or breakdown. Right now, XRP's structure is still organized and intact, meaning the setup is still in play. The question is just when and how it resolves.
 Usman Salis


