 Usman Salis

⬤ XRP's holding a steady upward structure that's caught market attention—the asset's following a staircase-style progression on the chart. The pattern remains intact, showing a series of consolidation zones followed by expansion phases that have shaped recent price movement. The chart highlights how XRP's been forming higher levels over time, reinforcing this trend's continuation.
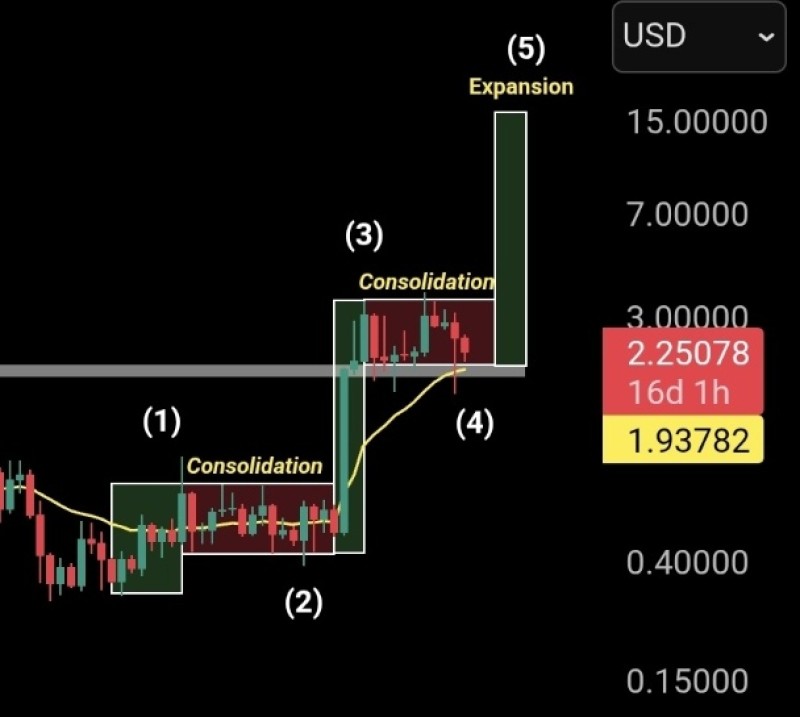
⬤ The chart shows several clearly defined steps marked as phases (1), (2), (3), and (4)—each transitioning from brief sideways trading into sharp upward moves. These consolidation zones indicate accumulation before expansion, with the latest step forming near the 2.25 area. There's also a projected phase (5) on the chart, illustrating potential continuation of the staircase structure if the trend holds. The projection simply demonstrates how each previous phase behaved under similar conditions.
⬤ XRP's trend structure has emphasized consistency throughout, with a repeating rhythm of consolidation followed by expansion. This sequence suggests momentum remains present while price holds above the highlighted support region. The most recent consolidation zone around the fourth step shows price stabilizing after an earlier rise—matching how earlier phases developed before advancing.
⬤ This staircase pattern matters because it reflects steady trend behavior that can influence broader market sentiment. A clear, orderly structure often strengthens confidence during pullbacks, while repetitive continuation phases help shape expectations about trend resilience. Whether XRP progresses into the next expansion phase depends on market conditions, but the intact structure provides a solid reference point for evaluating momentum in current price action.
 Usman Salis


