Peter Smith
Ripple's XRP is facing a critical moment as it battles to break above a widely-watched technical threshold. After rebounding from lower support zones, the cryptocurrency now finds itself testing resistance at the macro 0.618 Fibonacci level near $1.47. This technical standoff has traders watching closely to see if bulls can push through or if another rejection will send prices lower.
XRP Tests Key $1.47 Fibonacci Resistance After Recent Bounce
XRP's price movement has hit a wall at the macro 0.618 Fibonacci level around $1.47, a crucial barrier that previously served as a structural pivot zone. This level is now acting as resistance rather than support, with XRP trading near $1.4648. The four-hour chart shows the token struggling to reclaim this retracement threshold following a bounce off deeper correction lows.
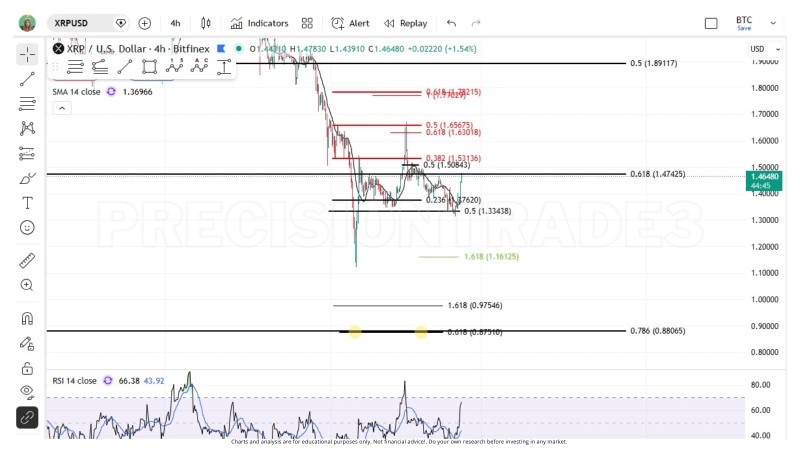
The chart reveals important Fibonacci levels from recent swing highs and lows. The macro 0.618 retracement at approximately $1.47425 appears as a horizontal line just above current price action. XRP's prior advance stalled beneath this level before reversing lower, making a close back above it a significant technical hurdle.
Below the macro 0.618, the 0.5 retracement near $1.33438 and the 0.236 level around $1.37620 mark near-term support regions where price found stability before its recent rebound. Price oscillating between these zones shows the ongoing battle between buyers and sellers as the market tests whether the recent swing low represents a solid foundation.
Technical Indicators Show Mixed Signals at $1.47 Barrier
On shorter timeframes, momentum indicators like the RSI display strengthening readings, with the relative strength index climbing from lower ranges toward neutral territory. However, the failure to clear the 0.618 resistance means bullish confirmation remains incomplete. Moving averages shown on the chart reflect dynamic lines that have influenced recent price movement, but resistance at $1.47 continues capping upside attempts.
The test of this macro 0.618 Fibonacci level matters because these retracement zones are widely monitored technical thresholds that often mark major turning points. XRP's current struggle below $1.47 reflects hesitation around this key resistance. A clean break and close above this Fibonacci band would signal a shift in short-term structure and potentially open the door for further gains. Conversely, sustained rejection could indicate the market's corrective phase remains active, potentially leading to a retest of lower support levels.
 Peter Smith