 Usman Salis

⬤ XRP is testing a major support zone around $1.80 after dropping sharply from levels above $3.20. The weekly chart shows a steep, inverse parabolic decline that looks remarkably similar to previous selloffs that came right before explosive rallies. This support area has historically been where buyers step in to stop aggressive selling.
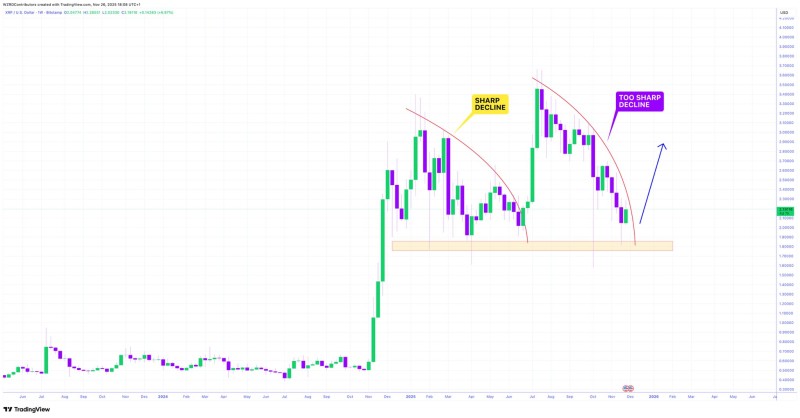
⬤ The chart reveals two distinct arcs showing how XRP repeatedly falls into steep, rounded declines before stabilizing at this same zone. The current drop mirrors an earlier pattern from this year—same slope, same curvature. Back then, XRP consolidated at this support band before launching a rally that pushed price above $2.80. The pattern is repeating almost identically.
⬤ XRP is now at a critical inflection point. If it holds above $1.80, sentiment could shift quickly and open the door for a broader recovery. But if support breaks, the medium-term outlook changes. With volatility picking up, traders are watching closely to see if this sharp decline becomes the setup for another strong upside move—just like it has before.
 Usman Salis


