 Saad Ullah
⬤ XRP has dropped to around $1.92, breaking cleanly through the horizontal support that previously provided short-term stability. The chart shows price trading beneath the $2.00 level, with a clear breach of support that many traders had been watching. This breakdown marks a shift in momentum as sellers continue pushing the price lower.
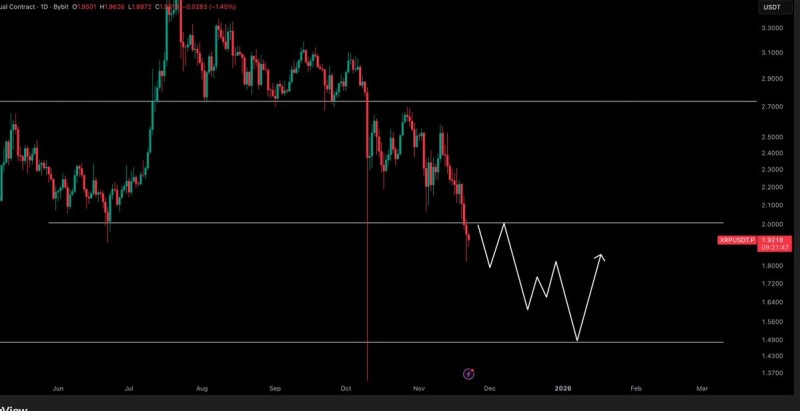
⬤ The projected path reflects continued downward movement ahead. Price action following the support breach has formed a clear series of lower highs and lower lows, signaling persistent selling pressure. The chart suggests XRP could consolidate briefly beneath the $2.00 resistance before resuming its decline. The forecasted pattern shows a potential move toward the mid-$1.50 region, with the next major support level appearing near $1.45. These visual cues match up with the bearish sentiment in the market.
⬤ The broader technical picture shows XRP remains in a sustained corrective phase after failing to reclaim the upper range near $2.70 earlier in the cycle. Momentum has weakened considerably through Q4, and the chart's projected volatility into early 2026 suggests a prolonged period of choppy trading. A possible rebound is shown only after testing deeper support levels, with an upward arrow marking where a recovery attempt might emerge.
⬤ This breakdown matters because confirmed breaks below key support levels often influence sentiment across the entire crypto market. XRP trading under $2.00 puts increased focus on whether buyers will step in at lower levels or if downward momentum will keep driving price action lower. How the market behaves around the $1.45-$1.50 zone could shape near-term expectations for the broader cryptocurrency environment.
 Saad Ullah


