 Eseandre Mordi

⬤ XRP hit a critical technical moment this week, closing below the 100-week EMA around $1.58. This moving average has traditionally separated bull markets from bear territory, and losing it puts XRP in uncharted waters for the first time since 2022. The breakdown has traders pulling up old charts to see what happened last time—and the comparison isn't pretty.
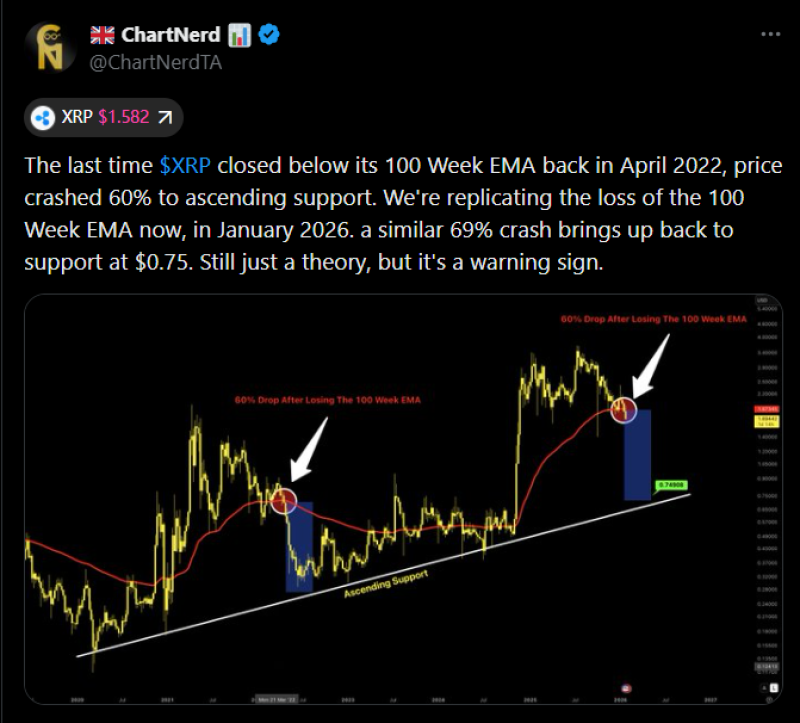
⬤ Back in April 2022, XRP fell through this same level and kept falling. The chart shows that breakdown led to a 60% collapse before price finally bounced off a long-term ascending trendline. That trendline is still holding today, but XRP is now testing it from above after losing the 100-week EMA support. The structural setup looks eerily similar to two years ago.
⬤ If the 2022 pattern plays out again, XRP could slide all the way down to $0.75—where that ascending support line is expected to sit. That would mean a 69% drop from current levels. The chart labels this as a theoretical scenario, not a prediction, but it's based on what actually happened the last time XRP broke this level. It's a warning flare, not a guarantee.
⬤ This matters beyond just XRP holders. As one of the top large-cap cryptos, XRP often acts as a bellwether for broader market sentiment. When major assets lose long-term trend support like the 100-week EMA, volatility tends to spike across the board. Whether XRP holds that ascending trendline or breaks lower will shape its next few months—and potentially signal where other altcoins are headed. Right now, the historical precedent is flashing red.
 Eseandre Mordi


