 Artem Voloskovets
XRP has caught traders' attention again after weeks of sideways movement and a sharp liquidation event. The analysis compares charts from both Binance and Coinbase, revealing strikingly similar patterns that strengthen the technical case for a major upward move.
Chart Analysis: Fibonacci Levels Define the Path
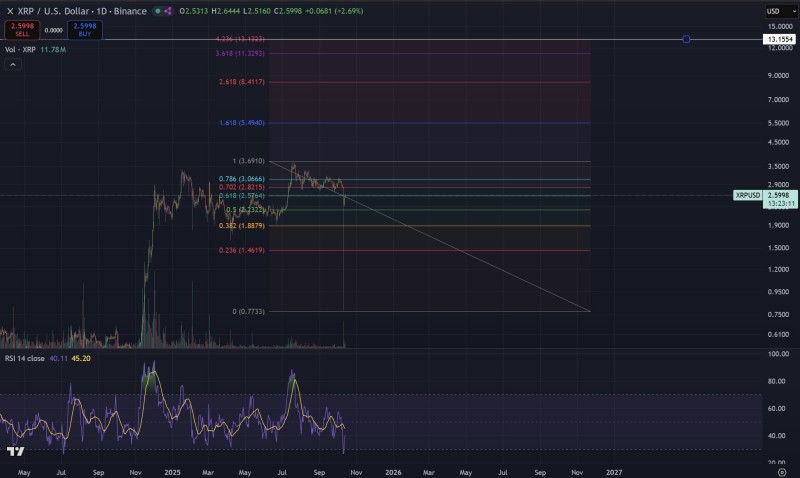
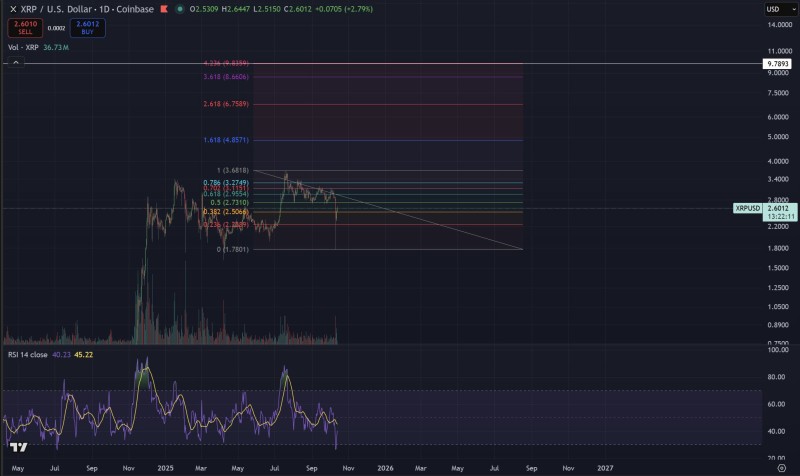
Technical analyst Cryptoinsightuk recently examined XRP's price structure using Fibonacci extensions from the previous rally, identifying a potential path toward $8–$12. Both Binance and Coinbase daily charts display nearly identical setups when Fibonacci retracement and extension tools are applied. XRP currently trades around $2.60, sitting between the 0.618 retracement level (around $2.40–$2.56) and the 0.702–0.786 zone ($2.81–$3.07). The immediate resistance barrier lies between $3.06 and $3.69, and breaking above this range would signal the start of a fresh bullish phase. On the downside, support emerges near $1.88 and $1.46 if selling pressure returns. Looking at Fibonacci extension targets, the 1.618 level points to $4.85–$5.49, the 2.618 extension sits at $6.75–$8.41, the 3.618 projects $8.60–$11.32, and the 4.236 suggests $9.78–$13.15. These projections align closely with the $8–$12 target zone highlighted in the original analysis. The Relative Strength Index hovers around 40–45 on both charts, indicating neutral momentum with plenty of room for upward movement without being overbought. Recent volume spikes during the liquidation wick suggest possible capitulation, which often precedes bullish reversals as weaker positions get flushed out and new buyers enter.
What's Driving the Narrative?
Crypto markets tend to rebound strongly after forced liquidations clear out overleveraged positions. Beyond technical factors, Ripple's ongoing legal situation with the SEC continues shaping market sentiment, with any positive developments boosting confidence in XRP's long-term prospects. Additionally, as Bitcoin enters consolidation phases, speculative capital often rotates into established altcoins like XRP, creating momentum for price expansion.
If XRP maintains its position above current retracement supports and pushes through the $3.50–$3.70 resistance zone, the Fibonacci framework suggests the next bullish leg could propel prices toward the $8–$12 range. However, failure to hold this structure might send XRP back to test lower supports around $1.80–$1.40 before attempting another rally.
XRP's current Fibonacci setup presents an intriguing technical picture: consolidation near key retracement levels, volume-driven liquidation events, and well-defined upside targets. With multiple extension projections converging in the $8–$12 zone, the charts indicate substantial potential if the token can break through resistance. While no prediction is certain, the technical alignment across multiple exchanges adds weight to the bullish scenario.
 Artem Voloskovets


