 Saad Ullah
XRP's price action is catching traders' attention for an interesting reason: the chart looks eerily familiar.
What the Charts Show
According to analyst STEPH IS CRYPTO, the token's current weekly structure mirrors the pattern that formed just before its legendary 2017 breakout, when it climbed from pocket change to over $3 in less than a year. With XRP now hovering around $2.50, the crypto community is buzzing about whether we're looking at a similar setup.
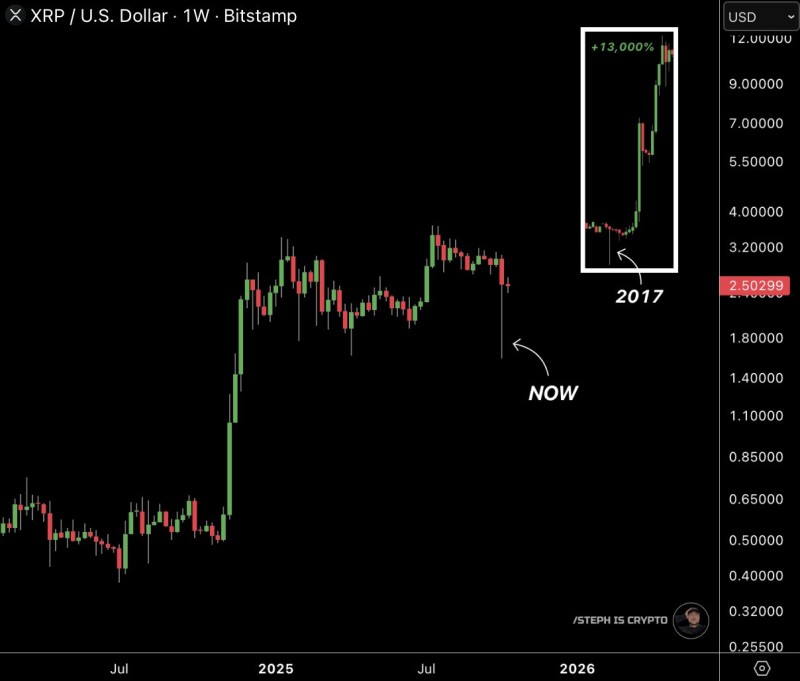
The comparison reveals two distinct periods. In 2017, XRP delivered a jaw-dropping 13,000% rally that became one of crypto's most talked-about success stories. Today's chart shows the token consolidating after a strong upward move, with $2.00 acting as a critical support floor and resistance appearing near $5.00. Bulls are eyeing psychological levels between $8.00 and $10.00 if momentum continues. The current sideways trading echoes the "quiet period" that preceded the 2017 explosion, when consolidation suddenly gave way to a vertical climb.
Why the Optimism
There are real reasons traders are paying attention beyond pattern recognition. Ripple's partnerships in cross-border payments keep expanding, giving XRP tangible utility in the financial system. The legal fog that hung over the project has largely cleared in the U.S., bringing institutional players back to the table. And crypto markets tend to move in cycles—many see this consolidation phase as textbook pre-breakout behavior.
Excitement aside, a dose of perspective matters here. A 13,000% rally is an outlier event, not a baseline expectation, and chart patterns don't come with guarantees. XRP's price remains tightly linked to Bitcoin's movements and broader market sentiment, which can shift quickly. Macro factors like global liquidity conditions, regulatory developments, and overall risk appetite will ultimately determine whether this setup delivers or disappoints.
 Saad Ullah


