 Usman Salis
⬤ XRP has finally broken free from a descending wedge that had capped its price for four straight years — from 2020 all the way through 2024. Once that resistance cracked, the coin surged over600%from the $0.60 breakout zone. That's not a fluke. That's a macro trend shift, and the chart structure backs it up.
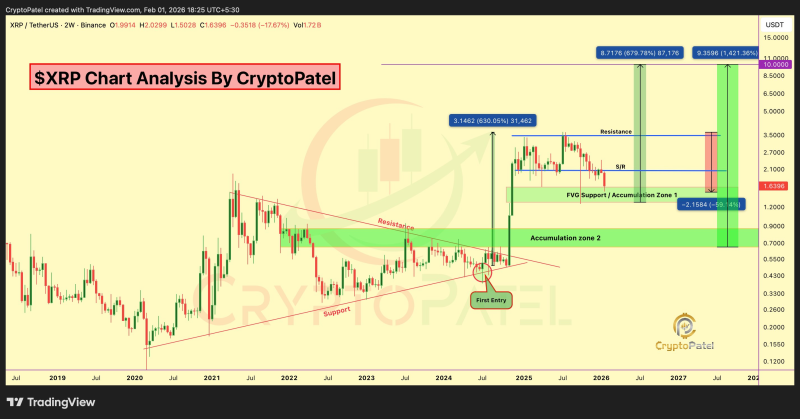
⬤ After that sharp run-up, XRP pulled back into a range between roughly $1.00 and $1.50— and that's actually a good sign. The coin isn't collapsing; it's consolidating. There's a fair value gap and a clear accumulation zone right in that band, and price has been holding steady there rather than breaking down. It's currently sitting about60%below its recent all-time high of $3.66.
⬤ The key level to watch right now is$1.00. As long as XRP stays above it, the bullish structure stays intact. Below that, there are deeper support zones marked on the chart, but the overall framework hasn't changed. Higher-timeframe targets still point toward the upper price range, especially if history repeats after long consolidation periods.
⬤ Why does this matter beyond XRP? Because when a top-10 crypto breaks out after years of range-trading and then enters a re-accumulation phase, it tends to move the whole market's sentiment. XRP is holding above long-term support and staying within its accumulation range — the next big question is whether it resumes the uptrend or digs into a deeper correction first.XRP Market Analysis
 Usman Salis


