 Usman Salis
They say history doesn't repeat, but it sure does rhyme. That's exactly what XRP traders are seeing right now. The current price action looks suspiciously like the setup before XRP's insane 2017 rally - you know, the one that took it from under $0.30 to nearly $3 in just weeks.
Key Technical Similarities
Trader STEPH IS CRYPTO spotted the pattern, and honestly, the similarities are hard to ignore. If this plays out like last time, we could be looking at another parabolic move that catches everyone off guard.
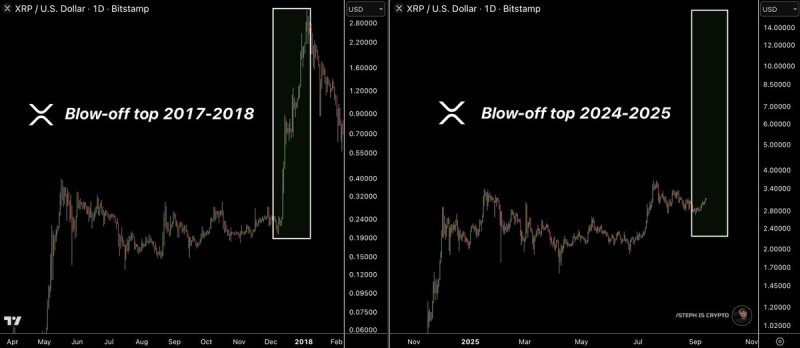
The 2017-2018 blow-off top saw XRP absolutely explode from pocket change to nearly three bucks before reality hit. Fast forward to today, and we're seeing XRP consolidate between $2.50 and $3.00 in what looks like the same pre-breakout structure. The projected blow-off zone is pointing toward some pretty wild numbers - we're talking $10 to $14 if this pattern actually delivers.
What makes this interesting is how XRP tends to move in these cycles. It usually sits quiet while Bitcoin does its thing, then suddenly goes parabolic when liquidity starts rotating into alts. That's classic altseason behavior, and we might be setting up for round two.
What's Driving the Momentum
Ripple's been busy building real utility in cross-border payments, and the regulatory mess that plagued them for years is finally clearing up. Financial institutions are actually using their tech now, which gives XRP something most cryptos lack - actual fundamentals. But let's be honest, in a bull market, fundamentals often take a backseat to pure speculation and FOMO.
The technical setup is what's got traders excited though. When you see the same pattern forming twice, especially one that previously delivered 900% gains, people pay attention. The resistance zone around $3.50 is the line in the sand. Break above $5 with conviction, and things could get interesting fast.
 Usman Salis


