 Peter Smith

⬤ A recent technical analysis highlights a "moment of truth" for XRP, using a long-term weekly chart that compares current price action with major historical cycles. The chart shows how XRP dropped –76.31% in 2018 and –63.67% in 2021 before bouncing back, and it maps out a potential path heading toward 2025.
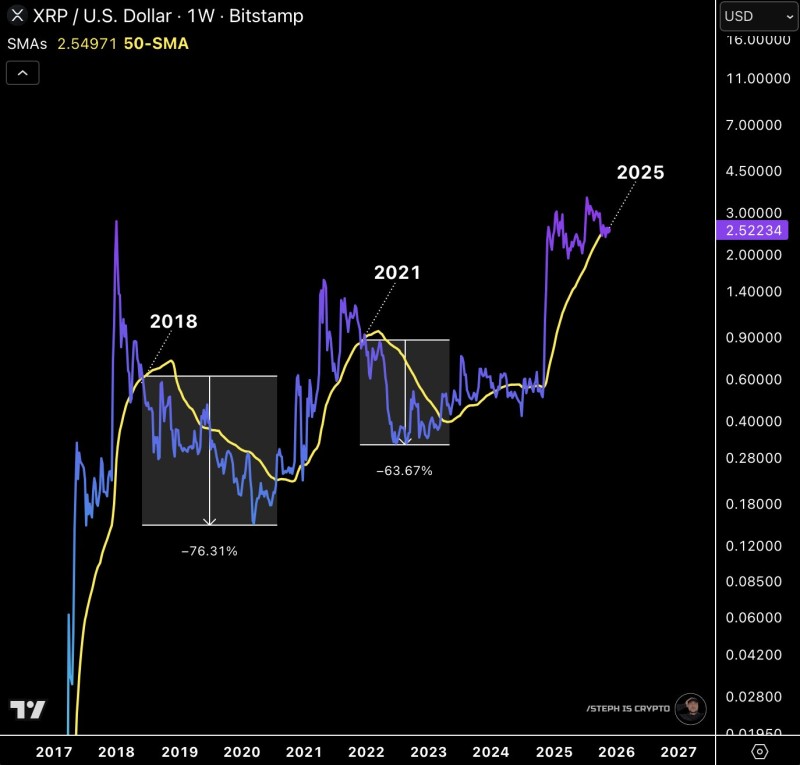
⬤ The analysis focuses heavily on XRP's relationship with its 50-week simple moving average (50-SMA), which has historically lined up with major trend reversals. The chart projection suggests XRP may be approaching another critical level where the next big move gets decided.
⬤ This matters for anyone watching XRP because these long-term technical patterns often drive broader market sentiment. If XRP holds strong above its current support zone, it could fuel expectations of continued gains into 2025, just as the chart suggests. But if it breaks below, we might see another extended consolidation period similar to what happened after previous corrections. Right now, the chart patterns and historical behavior are pointing to a make-or-break moment.
 Peter Smith


