 Alex Dudov

Stellar has been sliding lower for weeks, and now it's approaching a level that could change everything. The $0.22 support zone has historically acted as a turning point for XLM, triggering strong rebounds when tested. With the price currently hovering near $0.258, the crypto is just a small drop away from this crucial area. What happens next at this level could determine whether XLM finds its footing or continues deeper into bearish territory.
Stellar Hits a Make-or-Break Zone
Stellar is approaching one of its most important technical levels of the year. After sliding steadily lower over recent weeks, XLM is now testing the $0.22 support area — a zone that's triggered significant bounces before.
The price is sitting at a crossroads, and what happens at this level could determine the next major trend.
Key Levels That Matter for XLM
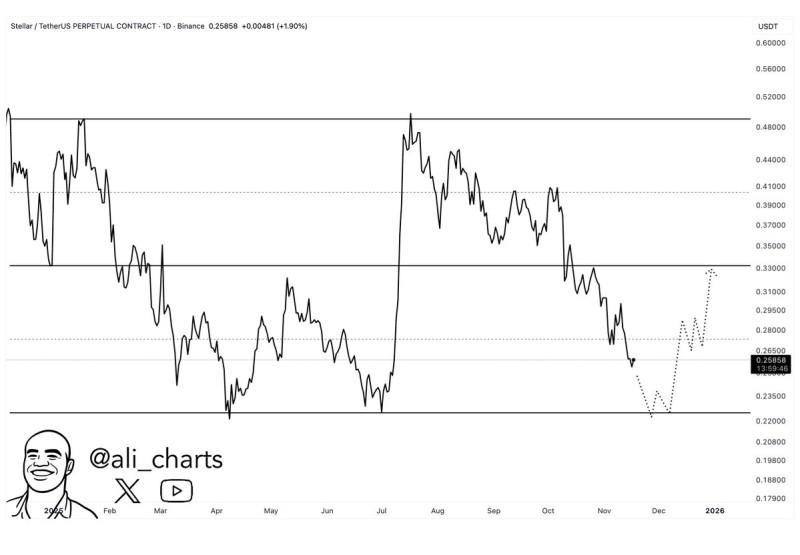
Looking at the XLM/USDT daily chart, the structure is straightforward. There are three horizontal levels that keep showing up:
- Resistance at $0.52
- Mid-level resistance around $0.33
- Support at $0.22
Right now, XLM is trading near $0.258 and drifting lower. Earlier this year, it tried pushing above $0.33 but couldn't hold. Since then, it's been making lower highs and lower lows, gradually sliding toward that $0.22 floor.
The chart shows two possible scenarios from here: either XLM dips down to fully test $0.22 before bouncing, or it catches a bid at current levels and starts climbing back toward $0.33. Either way, that $0.22 zone is the line in the sand.
Why XLM Dropped to These Levels
The decline wasn't sudden. XLM peaked near $0.44 over the summer, and each rally since then got weaker, with lower highs forming. October and November saw the drop accelerate.
Bitcoin's dominance has been squeezing altcoins like Stellar, and broader market uncertainty hasn't helped. Meanwhile, Stellar's ecosystem updates haven't been enough to reignite buying interest. That's left XLM vulnerable, pushing it down to a level where long-term holders often step back in.
What a Bounce Could Look Like
Assuming XLM finds support at $0.22, the chart lays out a clear recovery route with first resistance between $0.265 and $0.280, then a bigger target at $0.33.
Getting back above $0.33 would shift the whole picture, but the immediate focus is whether buyers show up at $0.22. That's where the real test begins.
XLM at a Critical Turning Point
Stellar is sitting at one of the most important spots on its chart. The $0.22 support zone has worked before, and traders are watching to see if it holds again. If it does, a move back toward $0.33 becomes realistic. If it breaks, new lows are on the table. The next few days will tell us which way this goes.
 Alex Dudov


