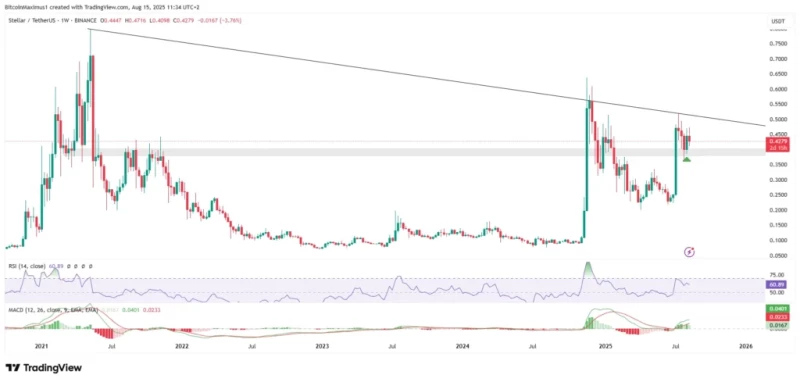
Stellar (XLM) is at a make-or-break moment. After getting crushed under a falling resistance line since 2021, the crypto just bounced off crucial $0.40 support and is making another run at breaking free. This time feels different though - momentum indicators are finally turning bullish, and technical patterns suggest the pullback might actually be over.
The big question now is whether XLM can finally punch through that stubborn resistance that's been capping it for nearly four years. If it does, bulls are eyeing a quick move to $0.60. But if it fails again, we could see another painful leg down.
XLM Technical Analysis Shows Bullish Momentum Building
Stellar has been stuck in technical jail since May 2021, trapped under a descending resistance line that's rejected every breakout attempt. We've seen this movie three times already, with the most recent rejection happening in July. But here's what's different this time.
Last week's bounce at $0.40 wasn't just any ordinary bounce - it formed a textbook bullish engulfing pattern that stopped the selloff dead in its tracks. That's the kind of price action that gets technical traders excited, especially when it happens at such a critical support level.

The momentum indicators are backing up this bullish story too. The RSI has climbed back above 50, showing buyers are starting to take control. Meanwhile, the MACD just flipped positive, which often signals the start of a new uptrend. As long as XLM holds above $0.40, the technical setup looks pretty promising for the rest of 2025.
Stellar (XLM) Wave Count Points to $0.61 Target
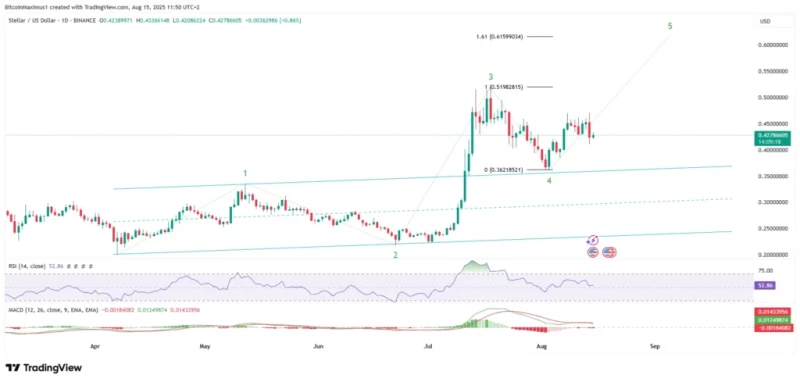
Here's where things get interesting from an Elliott Wave perspective. The most likely scenario is that XLM just finished wave four of a five-wave rally, with that pullback ending on August 3rd. If this count is right, we're now entering wave five - typically the final explosive leg higher.

The math points to a target around $0.61, which sits just above that pesky long-term resistance line. But here's the thing that's bugging analysts: breaking a four-year trendline should trigger more fireworks than just a modest move to $0.61. Usually, when crypto breaks major resistance like this, it goes parabolic.
That's creating some doubt about whether this wave count is actually correct. The RSI and MACD were still declining when this analysis was done, which doesn't exactly scream "fifth wave incoming." So while the structure looks clean, the momentum divergence is raising some red flags.
XLM Price Prediction Faces Mixed Signals in Short Term
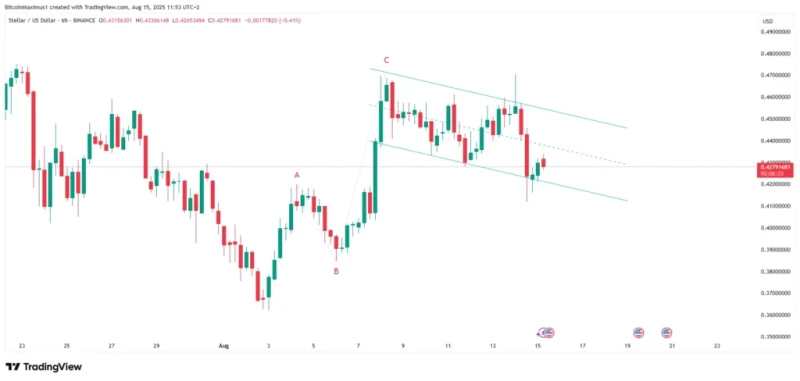
The short-term picture is honestly a bit of a mess right now. XLM is trading inside a descending channel (bearish) but has also completed what looks like an A-B-C correction (potentially bullish). It's like the market can't make up its mind.

The six-hour chart isn't helping clear things up either. There are valid arguments for both corrective and impulsive patterns, which basically means we're in wait-and-see mode. What we do know is that an eventual breakout from the long-term resistance seems likely - we just don't know exactly how we'll get there.
 Usman Salis

 Usman Salis


