 Marina Lyubimova

Stellar (XLM) surged 3.79% to $0.46 as technical indicators flash bullish signals, with traders eyeing a potential breakout toward the $0.52 resistance zone.
XLM just grabbed attention with a solid 3.79% pump to $0.46, and it's all about the technicals. No big news dropped – just pure chart action that's got traders buzzing. The RSI at 62.37 means there's still room to run, while $39.1 million in Binance volume shows serious interest. XLM is now cruising above key moving averages at $0.43 and $0.42, which is exactly what you want to see.
XLM Technical Setup: Charts Looking Bullish
The technical picture is pretty sweet right now. That RSI at 62.37 sits in the goldilocks zone – not too hot, not too cold. The real star is the MACD with the main line at 0.0164 above the signal line at 0.0153, plus a positive histogram of 0.0011. This setup often leads to serious price action.
Stochastic indicators are getting spicy with %K at 89.41 and %D at 82.13 – close to overbought but can stay elevated in strong trends. With XLM at 89% of its Bollinger Band range, we're knocking on the door of that $0.47 upper band.
Stellar (XLM) Price Targets: Where This Could Go
XLM sits at $0.46 between $0.47 resistance and the $0.45 pivot point. If Stellar cracks through $0.47 with decent volume, we could see a run toward $0.52 – right around that 52-week high of $0.51. Breaking that would be huge.
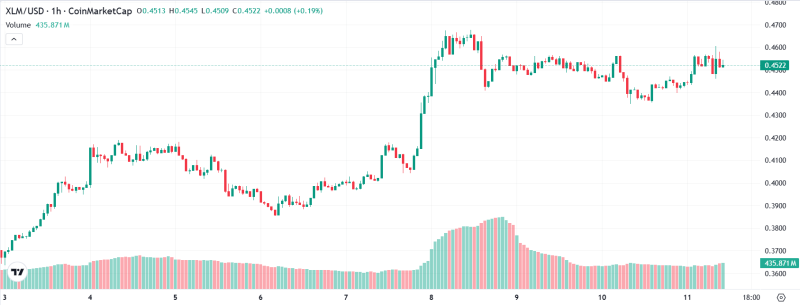
Support sits around $0.43 where the shorter moving averages hang out, with deeper support at $0.36. The daily ATR of $0.03 means typical 3-cent ranges, so we're at a critical juncture.
Should You Jump on XLM?
The technical setup is tempting with that bullish MACD, but remember XLM is already 48% above its 200-day moving average at $0.31. No major bad news is weighing on Stellar, but technical moves can reverse quickly. Keep position sizes reasonable and have an exit plan ready. The next day or two will tell us if this rally has legs.
 Marina Lyubimova


