 Usman Salis

TRON's network is buzzing with record-breaking activity as daily active addresses hit all-time highs, while TRX sits at $0.2726 showing mixed signals that could spell big moves ahead.
TRON (TRX) Network Goes Absolutely Crazy With User Growth
Something pretty exciting is happening with TRON right now. The network's daily active addresses just smashed through all previous records, and honestly, it's getting hard to ignore. CryptoQuant analyst CryptoOnChain dropped some seriously impressive data on June 3, showing that both the 50-day and 100-day moving averages for daily active users have hit historic peaks. We're talking about genuine, sustained growth here – not just some flash-in-the-pan spike.
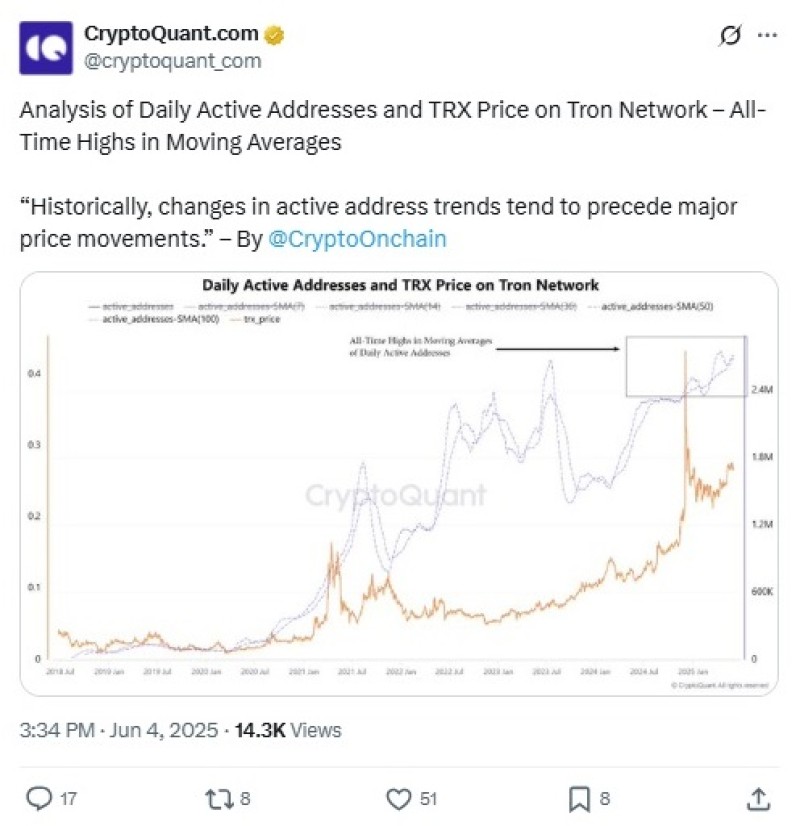
But here's where it gets really interesting. Another CryptoQuant contributor, Darkfost, pointed out that TRON is now crushing over 8 million daily transactions. That's a massive 30% jump from what we saw back in early February. And get this – these aren't just numbers getting pumped up by exchange shuffling. This is real, organic activity happening directly on the blockchain.
What's driving all this action? Well, TRON's been offering some pretty sweet yields and services that are pulling in serious liquidity. New users keep flooding in because, let's face it, who doesn't want better returns? It's creating this snowball effect where more activity brings more users, which brings even more activity. Classic network effect stuff, but it's actually working.
TRX Price Sitting Pretty But Playing Hard to Get
Now here's the weird part – with all this incredible network growth, TRX price action has been, well, kind of boring. Right now it's trading at $0.2726, up about 1.2% today and roughly 10% over the past month. Not terrible, but nothing to write home about either. The thing is, TRX is still sitting about 36% below that juicy December 2024 peak of $0.4313. So there's definitely room to run if things line up right.
From a technical standpoint, TRX is giving us some seriously mixed vibes. It's hanging out near the top of its daily Bollinger Bands, which usually means volatility is about to pick up and we might see a breakout attempt soon. The moving averages are looking pretty friendly too – both the 20-day and 50-day EMAs are sitting below current price, giving TRX some solid support.
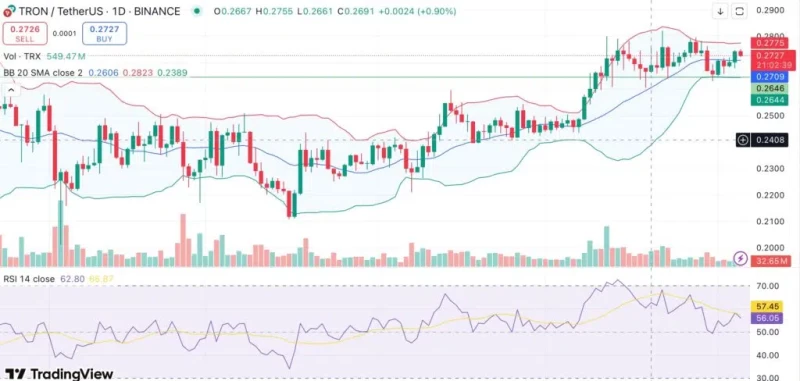
But hold up – the oscillators aren't exactly screaming "moon mission" right now. They're sitting mostly neutral or slightly bearish, which could mean we're heading into some sideways action or even a small pullback. The RSI is chilling at 56, so we're nowhere near overbought territory, but the Momentum and MACD are showing that upward push is starting to lose some steam.
Key TRX Levels That Could Make or Break the Next Move
Alright, so here's what traders need to watch. If TRX can punch through that $0.278 resistance level, things could get spicy real quick. Breaking that barrier might just open the floodgates and get us eyeing that sweet $0.30 psychological level that everyone's been waiting for.
On the flip side, if TRX can't hold its ground and drops below $0.264, we're probably looking at a deeper pullback scenario. In that case, $0.25 becomes the make-or-break level – if that doesn't hold, TRX might need to take a longer breather before making another run.
The whole situation is pretty fascinating when you think about it. You've got this absolutely crushing network performance with record users and transactions, but the price is just sitting there like it's waiting for something. Sometimes the market takes a while to catch up to fundamentals, and when it does, things can move fast. Whether TRX is building up for a major breakout or just taking its sweet time, those network numbers definitely suggest something bigger might be brewing under the hood.
 Usman Salis


