 Saad Ullah

Stellar (XLM) isn't having a great time lately. The crypto fell almost 2% over the past day and seems stuck in what traders call "sideways action" - basically going nowhere fast. At $0.2343 right now, XLM is caught between some key levels that'll likely decide where it heads next.
The thing is, neither buyers nor sellers are really taking control here. It's like watching a tug-of-war where nobody's winning, which usually means we're in for more of the same boring price action.
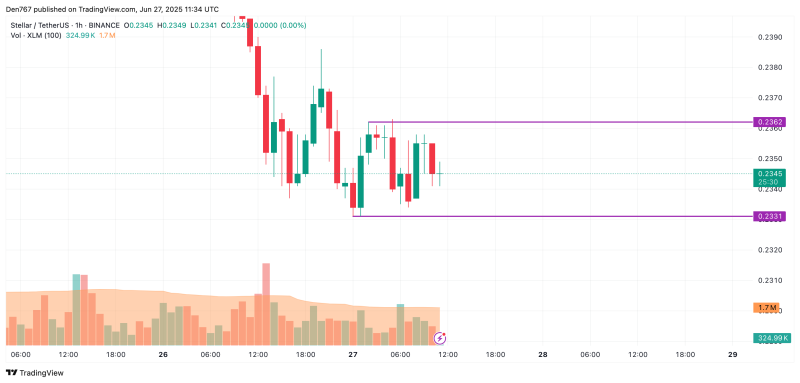
XLM Trading in Tight Range on Hourly Charts
Looking at the hourly charts, XLM is basically sandwiched between $0.2331 support and $0.2362 resistance. That's a pretty narrow range of just over 1%, showing how indecisive things are right now.
Since neither side is making any real moves, don't expect any fireworks by tomorrow. The volume just isn't there, and when volume is weak, big price swings rarely happen. Traders seem to be sitting on their hands, waiting for something - anything - to give them a clear direction.
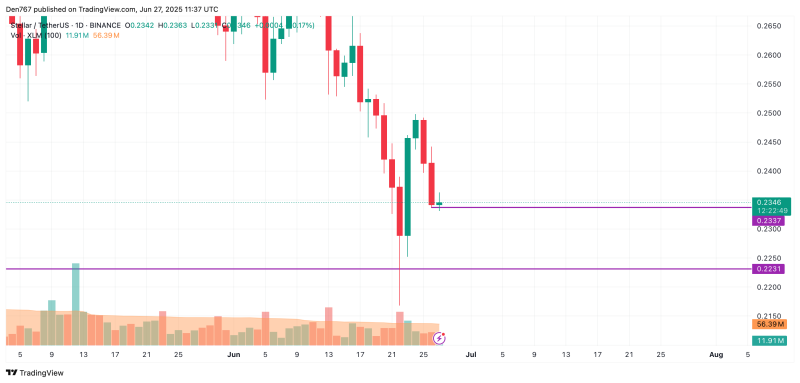
Daily Charts Show XLM Could Drop Further
Here's where things get a bit more concerning for XLM holders. The daily chart is flashing some warning signs that bulls probably don't want to see.
If today's candle closes below $0.2337 (yesterday's low), we could see XLM slide down to the $0.250-$0.23 area by week's end. That's not exactly what you'd call bullish price action.
The pattern here shows selling pressure building up gradually. Each time XLM tries to bounce, it fails to reach the previous highs - and that's typically not a good sign for any crypto.
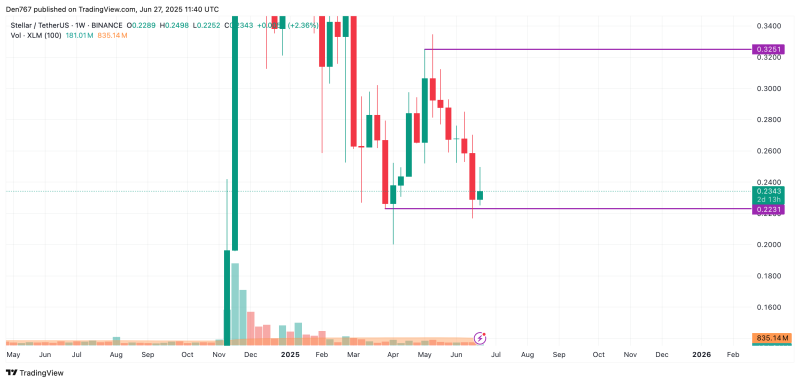
Medium-Term Outlook Points to $0.20 Test for XLM
Zooming out a bit, the picture gets even less pretty for Stellar (XLM). The crypto is trading way too close to support levels for comfort, and if bulls can't step up soon, we might see a proper breakdown.
If that happens, the next stop could be $0.20 - a psychologically important level that would represent a significant drop from here. The chart structure shows XLM making lower highs while struggling with higher lows, which is textbook bearish behavior.
Bottom line: XLM looks like it's in trouble. The sideways trading might continue for a while, but if support breaks, things could get ugly fast. Keep an eye on that $0.20 level - it's where the real battle will likely happen.
 Saad Ullah


