 Marina Lyubimova

Stellar (XLM) has quietly crushed it this July, jumping 31% after bouncing off key support at $0.22, but traders should watch for resistance ahead.
Stellar (XLM) has been having a pretty solid July, and honestly, it's been flying under the radar while everyone's been obsessing over Bitcoin's new all-time highs. After holding that crucial $0.22 support level like a champ, XLM has pumped 31% since July 2nd - not too shabby for an altcoin in this market.
The thing is, with Bitcoin hitting fresh records, there's this crazy bullish vibe across the entire crypto space right now. But here's the catch - all this excitement could lead to some serious volatility in the short term. So if you're thinking about jumping in, you better size your positions carefully and know your risk tolerance.
XLM Price Weekly Chart Shows Mixed Signals
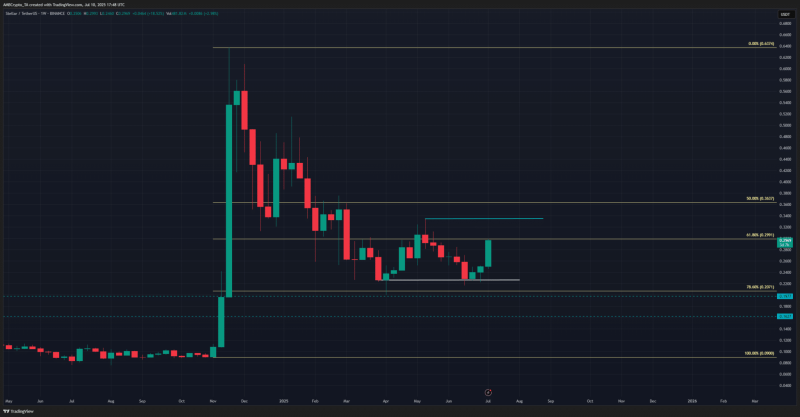
Looking at the weekly chart, it's kind of a mixed bag for XLM. After that massive November rally, the price took a pretty nasty hit and dropped all the way down to the 78.6% Fibonacci level at $0.207 back in April. That's a serious pullback that would've scared off a lot of weak hands.
What's interesting is that XLM almost tested that same support again at the start of July, hitting $0.217. The fact that it held and then bounced hard from there shows there's still some real demand at those levels.
But here's the reality check - the weekly chart is still looking bearish overall. XLM needs to close above $0.334 on the weekly timeframe to actually confirm this rally is for real. Until that happens, we're probably looking at more sideways action within a range.
For the long-term holders out there, these pullbacks might actually be decent accumulation opportunities since the asset seems to be entering a consolidation phase.
XLM Price Hits Wall at $0.30 Psychological Level
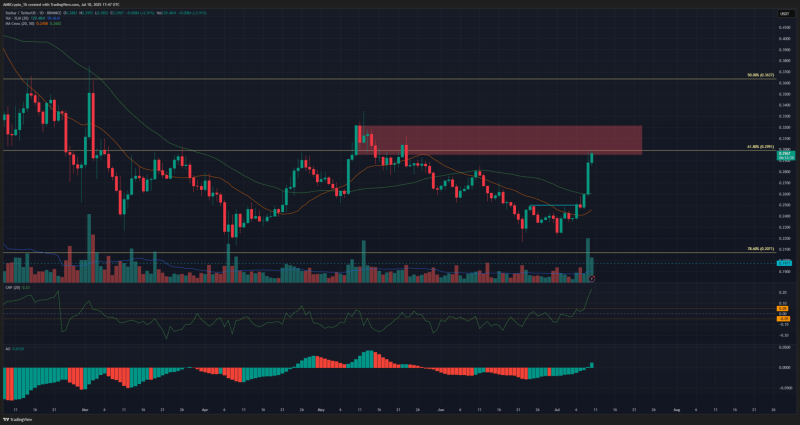
The daily chart tells a more optimistic story for July. XLM broke through that key $0.245 resistance and has gained another 20.1% since July 7th. That's some solid momentum right there.
The technical indicators are backing up this bullish move too. The CMF shot up above +0.05 and hit +0.23, which shows there's genuine buying pressure behind this rally. The Awesome Oscillator also crossed above zero, confirming the momentum shift.
But - and this is important - this might not be the best time to go long. The daily chart shows a bearish order block sitting between $0.295 and $0.32. If you're already long, this resistance zone might be a good spot to take some profits off the table.
What Traders Should Do Next with XLM
If XLM manages to flip that $0.295-$0.32 resistance into support, then swing traders could look for another entry. But right now, with Bitcoin leading the charge after hitting new highs, BTC might need to cool off and range for a bit before altcoins like XLM can really catch up.
The smart play here is probably to stay patient. Take profits if you're already in, and wait for a better setup if you're looking to enter. This market can change fast, and with all the euphoria around Bitcoin's new highs, things could get choppy real quick.
 Marina Lyubimova


