Peter Smith
⬤ Solana is sitting right at the bottom edge of its broader trading channel. The daily chart is starting to show what could be a bottom formation, lining up with a major support zone and key Fibonacci levels.
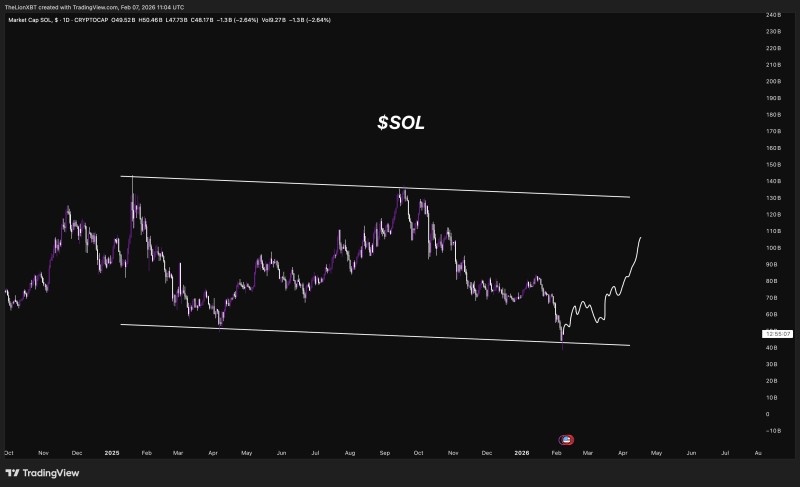
⬤ The chart reveals SOL hitting channel support head-on—a spot where we typically see reactions within these structured ranges. This level also lines up with a wider support area, making this zone even more significant for potential buyer interest.
⬤ This setup points to a critical watch zone rather than guaranteeing an immediate bounce. What happens next depends entirely on whether price holds within the channel or breaks below it—each outcome would completely reshape the technical picture.
⬤ Channel extremes like this often mark turning points in market phases. If support holds, we could see a base forming for the next move up. But a breakdown would signal the correction still has room to run.
 Peter Smith