 Peter Smith

⬤ Solana (SOL) is hovering around $123.79 on the SOLUSDT pair as fresh technical analysis points to a possible breakout from a falling wedge pattern. The immediate target sits at $133, and if SOL can reclaim that level, traders expect momentum to pick up. The chart, based on a two-hour timeframe, shows the token sliding lower through a tightening downward channel before stabilizing near the lower edge toward the end of December 2025.
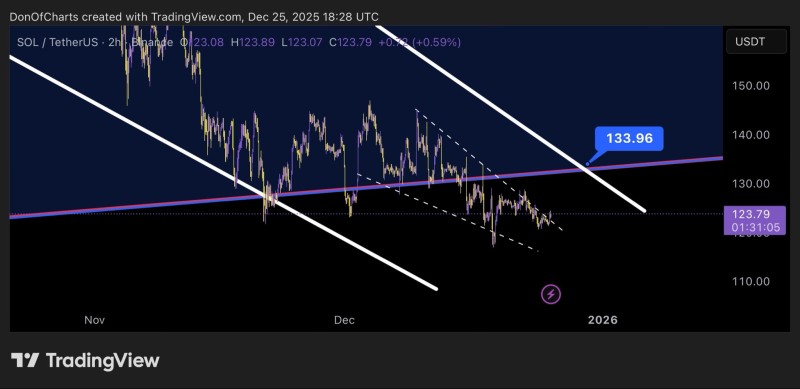
⬤ The $133 level is the first major checkpoint for Solana. The analysis suggests that once this zone is secured, price could "magnet" toward $206 and eventually $300. The chart layout backs this up with angled white trend lines showing the broader down channel, dashed lines marking the falling wedge, and a magenta trend line underneath that lines up with the reclaim zone.
⬤ Right now, Solana is still trading below the $133 mark but has started consolidating more tightly inside the wedge. This comes after weeks of downward pressure starting in early November, where SOL couldn't hold onto multiple recovery attempts. A clean break above the wedge resistance and a reclaim of $133 would signal a shift toward short-term bullish momentum and set up what could be a strong continuation move.
⬤ This matters because Solana remains one of the most actively traded altcoins, and clearly defined levels like $133, $206, and $300 can shape market sentiment. A confirmed breakout could influence trading behavior across the crypto market, while failure to reclaim these zones might keep SOL stuck in its recent downtrend.
 Peter Smith


