 Saad Ullah

⬤ A long-term Solana (SOL) price chart is making the rounds, mapping out what could be a multi-phase journey for the token. The weekly SOLUSDT chart shows SOL trading around $123.78, tracing a pattern of repeated peaks over the past two years followed by sharp drops marked with red arrows. The chart highlights three major tops where SOL fell hard afterward, with each peak circled to show the repeating structure.
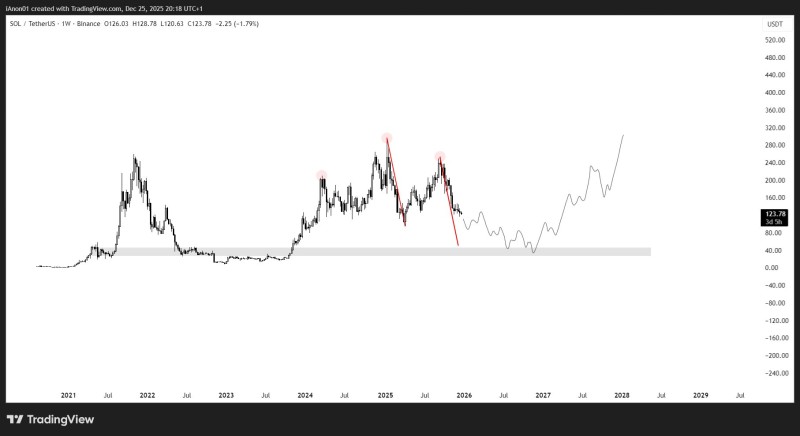
⬤ The most recent move shows another downturn from a local high, with a projected red path pointing toward a wide grey support band—roughly the same zone where Solana hung out through late 2022 and early 2023. That's where the price previously built a base before climbing back up, and the current projection suggests SOL might revisit that area before finding its footing again.
⬤ Beyond the potential dip into support, the chart outlines a gradual accumulation phase shown in a light grey path, followed by a steady recovery stretching across 2027 and into 2028. In that scenario, SOL eventually trends back toward higher levels, with the projected curve reaching above $200 later in the period. This is framed as a long-term swing setup rather than a quick trade, emphasizing the repeating rhythm of major peaks, pullbacks, and extended bases on the weekly chart.
⬤ This matters because Solana remains one of the most watched altcoins, and long-term chart scenarios help shape expectations around risk, timing, and market behavior. The idea of a deeper pullback into familiar support before a multi-year recovery puts SOL within a broader cyclical framework and highlights the ongoing volatility that defines the digital asset market.
 Saad Ullah


