 Artem Voloskovets
⬤ Solana has entered choppy territory after dropping below an important Fibonacci level, adding pressure to the near-term picture. Right now, SOL is sitting under the 0.382 Fibonacci mark—a spot that usually signals weak momentum in the short run. The chart shows price struggling to stay above a long-held resistance area, followed by a quick rejection that's now got traders watching lower support zones.
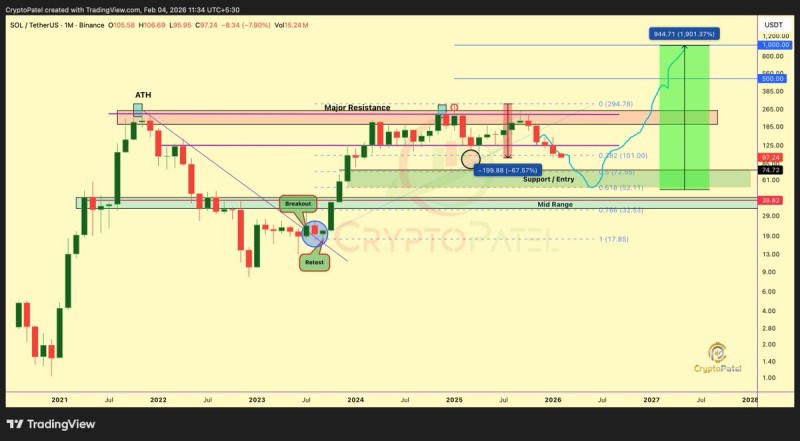
⬤ Looking at the chart, SOL has pulled back hard from its recent highs and is well below that 0.382 Fibonacci threshold. This slip puts the focus squarely on the $55 to $75 range, which stands out as a solid accumulation zone based on Fibonacci levels. The setup also reveals an earlier breakout-and-retest pattern from months back, which contrasts sharply with today's corrective move. If selling continues and support doesn't hold, another leg down toward $50 isn't off the table.
⬤ Still, the bigger picture isn't all doom and gloom if key support levels manage to hold firm. The broader structure hints that building a base somewhere between $55 and $75 could help reset things and give Solana room to regain its footing. The chart's long-term projection suggests possible upside targets ranging from $500 to $1,000, but that depends entirely on price climbing back above higher Fibonacci levels and reestablishing a bullish trend over time.
⬤ This technical picture matters for the wider crypto market since Solana remains one of the most heavily traded large-cap coins out there. The gap between short-term risk and long-term upside underscores how important structural resets are in trending markets. With SOL now positioned below a major retracement and nearing historically important support, how price behaves next could set the tone for Solana's upcoming market phase.
 Artem Voloskovets


