Victoria Bazir

⬤ Solana dropped back into a major demand zone after getting rejected from recent highs in the mid-$140s. The 4-hour SOL/USDT chart shows a liquidity sweep followed by a quick move down that landed price right in a previously identified support area. SOL is now trying to hold ground after this pullback, with buyers stepping in at what looks like an important technical level.
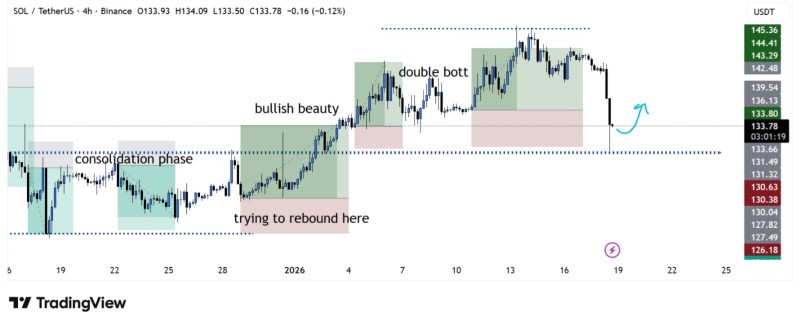
⬤ Before the drop, SOL climbed steadily through consolidation and put together a solid bullish run that pushed price into the mid-$140s. The chart shows a clean upward pattern with higher lows and a quick double-bottom setup before momentum started fading near resistance. When price couldn't stay above that zone, sellers took over and pushed SOL down fast toward the $133–$134 area, which traders are watching as a demand zone.
⬤ Recent candles show price squeezing near this support level, suggesting the selling might be slowing down. This looks more like a short-term bounce attempt rather than another leg down. While the overall structure broke down earlier, current price action shows SOL testing whether demand here can actually hold. If support holds, price could work its way back toward those previous highs based on the projected move shown on the chart.
⬤ This matters for the broader crypto market since Solana remains one of the most actively traded major assets. When big demand zones get tested like this, it often shifts short-term sentiment and direction across the sector. How SOL handles this level could shape what traders expect next, especially right now when everyone's watching closely to see how support zones react after sharp moves.
 Victoria Bazir