 Usman Salis
⬤ Solana is back under the microscope as fresh liquidation data exposes the pressure building on both sides of the market. Recent analysis shows that roughly $217.5 million in short positions would get wiped out if SOL manages a 10 percent rally from here. On the flip side, about $183.1 million in long positions are at risk if the token drops by the same percentage. These numbers reveal just how much leveraged betting has piled up as traders try to call Solana's next move.
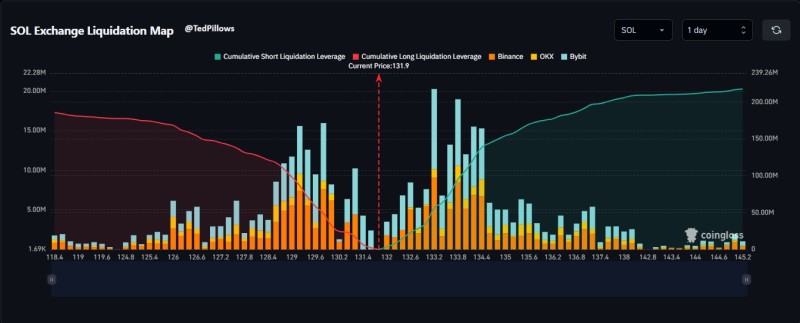
⬤ The liquidation heat map, which tracks positioning across Binance, OKX, and Bybit, paints a clear picture of where the danger zones sit. Short liquidations are stacked above current price levels, while long liquidations cluster below. With SOL hovering around $131.90 at the time of the data snapshot, the token is sitting right in the crossfire of both zones based on a 10 percent swing in either direction.
⬤ What stands out here is the imbalance: shorts currently face more liquidation risk than longs at the 10 percent threshold. That means an upward breakout could trigger a bigger chain reaction of forced closures than a similar drop would on the long side. But the leverage is spread across multiple price layers, so any sharp move could set off waves of liquidations that feed on themselves.
⬤ This setup keeps Solana's price action on edge. When liquidations start clustering like this, they tend to fuel bigger swings as forced selling or buying kicks in across exchanges. With these clear pressure points visible near current levels, SOL's next moves will likely hinge on which side of the leverage trade breaks first.
 Usman Salis


