 Sergey Diakov

After the explosive 2021 rally and smaller bounces through 2023–2024, Shiba Inu (SHIB) has entered a prolonged consolidation phase. The monthly chart reveals a clear accumulation pattern with exhausted momentum indicators, suggesting a potential reversal may be forming as the broader crypto market eyes a 2025 uptrend.
Shiba Inu Consolidates in Multi-Year Support Zone
The monthly SHIB chart analyzed by EᴛʜᴇʀNᴀꜱʏᴏɴᴀL trader shows the price has flattened into a horizontal support region between $0.000006 and $0.000010 after its dramatic 2021 peak.
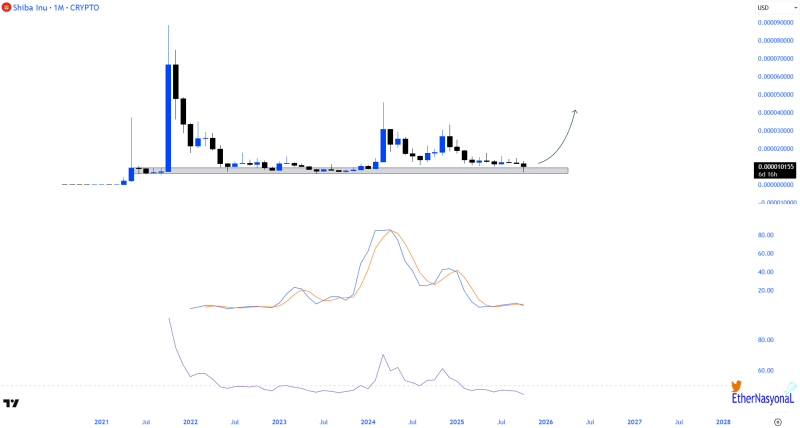
This multi-year accumulation zone displays three key patterns: reduced volatility with tightly compressed candles, stable support at the lower range, and quiet trading activity indicating possible positioning by whales and patient holders. The setup mirrors classic accumulation behavior where prices drift sideways while large investors gradually rebuild positions.
Momentum Indicators Signal Potential Bottoming
Two momentum oscillators beneath the main price graph both show extreme exhaustion. The MACD-like indicator has flattened, signaling depleted bearish pressure, while the secondary line shows minimal movement. Such compression historically precedes strong directional moves. Similar setups in early 2021 and mid-2023 were followed by sharp recoveries once buying volume returned.
Ecosystem Developments and Market Context
The Shiba Inu ecosystem continues evolving with its stabilized Shibarium Layer-2 network, growing transaction volumes, and gradual token burns reducing circulating supply. These fundamental improvements contribute to long-term structural strength. As the broader crypto market awaits a potential 2025 uptrend, meme-based assets like SHIB may benefit from renewed speculative flows following this deep consolidation period.
Quiet Accumulation Precedes Potential Upside
SHIB's multi-year base formation is approaching a decision point. If the price maintains stability above the current demand zone with rising momentum, a target near $0.000020–$0.000030 could become plausible over the medium term. Failure to hold support around $0.000007 would prolong the sideways phase. The overarching structure favors quiet accumulation, with subdued momentum and tight range representing the technical calm that often precedes volatility expansion.
 Sergey Diakov


