Saad Ullah

Shiba Inu has spent the past several weeks trading sideways after a prolonged decline, locking into a well-defined range that is now showing signs of exhaustion. The longer price stays boxed in, the greater the pressure building beneath the surface - and history suggests that kind of compression rarely stays quiet for long.
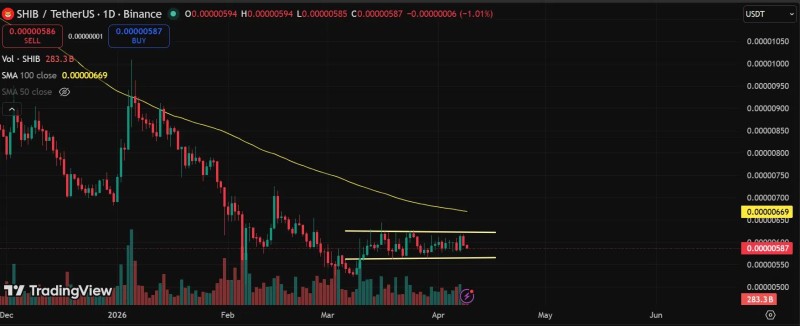
According to TheCryptoBasic, price has been contained between approximately $0.0000057 on the support side and $0.0000060 at resistance. Both levels have held through multiple tests, creating a structure that is increasingly difficult to ignore.
SHIB Shifts From Downtrend to Sideways Consolidation
SHIB entered its current range around March 11, transitioning from a sequence of lower highs into horizontal consolidation. Rather than continuing to fall, price stabilized and began forming a channel - a meaningful shift in behavior after weeks of steady selling pressure.
What makes the setup notable is not the size of the range, but how consistently price has respected it. Candles are compressing, swings are narrowing, and neither buyers nor sellers have managed to force a decisive move. That kind of standoff tends to resolve with momentum.
SHIB Support and Resistance Levels Define the Decision Zone
The behavior inside the channel follows a clear pattern. Attempts to push above $0.0000060 are capped by sellers clustered at that level, while dips toward $0.0000057 are consistently absorbed by buyers who refuse to let the structure break down. SHIB has previously shown similar behavior before sharp directional moves, particularly after extended compression phases.
Repeated rejections near $0.0000060 confirm the presence of sellers at that level, while the steady defense of $0.0000057 indicates buyers remain active below.
This balance between supply and demand is what keeps the range intact - but it also makes the eventual exit more significant. The longer price oscillates between the same two levels, the more likely it is that the next move carries real follow-through.
100-Day SMA Near $0.00000669 Caps Any SHIB Breakout Attempt
Even if SHIB clears the upper boundary of the channel, there is another obstacle waiting above: the 100-day simple moving average sitting near $0.00000669. Price has remained below this level throughout the consolidation, and it will act as dynamic resistance the moment any breakout attempt develops.
The 100-day SMA near $0.00000669 sits above the range, reinforcing its role as dynamic resistance - any breakout would immediately face this level as the next key test for continuation.
Reclaiming the 100-day SMA would be a significant technical event for SHIB. Until that happens, the broader structure remains capped despite the improved short-term stability the range provides.
SHIB Price Compression Points to Imminent Breakout Resolution
The key elements from the current chart setup:
- Consolidation channel between $0.0000057 and $0.0000060
- Repeated rejection at the upper boundary with no clean break higher
- Consistent defense of support without a breakdown attempt
- Price trading below the 100-day SMA near $0.00000669
The structure does not yet confirm which direction SHIB breaks. What it does confirm is that the available space inside the channel is shrinking. Key support levels remain critical to whether this resolves as a bullish breakout or a fresh leg lower. Either way, continuation inside this range is becoming less sustainable - and when the move comes, it is likely to develop quickly.
 Saad Ullah