 Usman Salis

⬤ Shiba Inu's price action is reaching a critical technical moment as SHIB continues trading within a narrowing triangle on the USDT chart. Price is holding near the 0.0000086 level, squeezed between repeated lower highs along a descending trendline and solid horizontal support below.
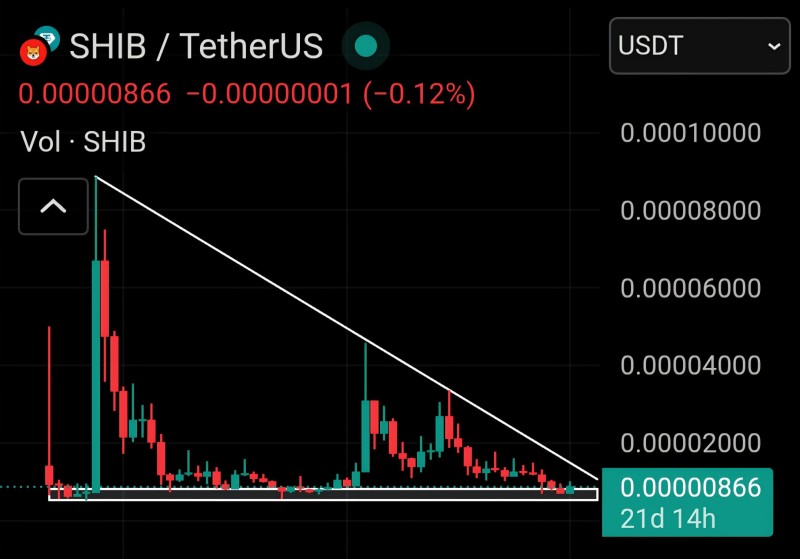
⬤ The chart shows an extended consolidation period following earlier volatility spikes. After sharp swings in previous cycles, SHIB has spent considerable time compressing into a tighter price range. This compression reflects declining volatility as buying and selling forces reach equilibrium. The descending trendline captures consistent selling pressure on rallies, while the flat support zone shows buyers continuing to defend the same price level. These elements combine to form a textbook triangle pattern marked by shrinking price swings.
⬤ Trading volume has also dropped during this consolidation, matching the narrowing range on the chart. These conditions typically develop before stronger moves emerge once the pattern breaks, though direction remains uncertain until a clear breakout occurs. A push above descending resistance would signal a bullish shift, while a drop below horizontal support would confirm downside continuation. For now, SHIB stays trapped inside the triangle, caught between support and resistance boundaries.
⬤ This setup matters for broader market sentiment since Shiba Inu remains one of the most actively traded meme tokens and tends to react quickly to speculative shifts. Extended compression phases often amplify volatility once price breaks out, influencing short-term momentum across the meme sector. With SHIB approaching the triangle's apex, focus is on how this consolidation resolves—the next directional move could shape near-term volatility and sentiment across related assets.
 Usman Salis


